Graylog datanode to Grafana

Before you post: Your responses to these questions will help the community help you. Please complete this template if you’re asking a support question.
Don’t forget to select tags to help index your topic!

1. Describe your incident:
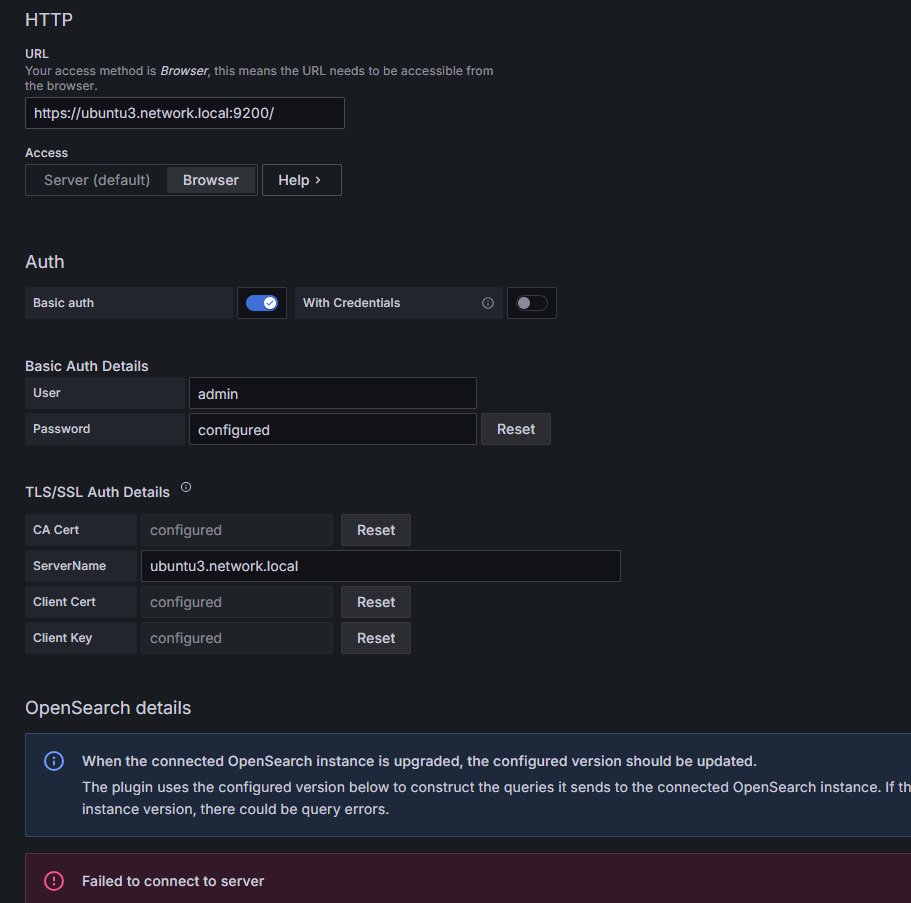
I get “Failed to connect to server” when I try to configure grafana-opensearch-datasource

2. Describe your environment:

3. What steps have you already taken to try and solve the problem?
I have tried localhost, 127.0.0.1, 192.168.xx.xx with port 9200 and get the same error.
user@ubuntu3:~$ curl localhost:9200/
curl: (52) Empty reply from server
So, I can’t even run the curl command on the graylog server, either.

4. How can the community help?

Helpful Posting Tips: Tips for Posting Questions that Get Answers [Hold down CTRL and link on link to open tips documents in a separate tab]

Your datanode server is most likely listening on https only, not plaintext http. That’s why you don’t get any response on 9200 port.

You will also need client certificates to access it: Graylog Datanode: admin access using client certification

I’m able to use curl to connect with https but I still can’t get connected from Grafana.
ahmuser@ubuntu3:/etc/graylog/certs$ curl “https://ubuntu3.network.local:9200/_cluster/health?pretty” -k --cert client-cert.crt --key client-cert.key --cacert CA.crt
Enter PEM pass phrase:
{
“cluster_name” : “datanode-cluster”,
“status” : “green”,
“timed_out” : false,
“number_of_nodes” : 1,
“number_of_data_nodes” : 1,
“discovered_master” : true,
“discovered_cluster_manager” : true,
“active_primary_shards” : 12,
“active_shards” : 12,
“relocating_shards” : 0,
“initializing_shards” : 0,
“unassigned_shards” : 0,
“delayed_unassigned_shards” : 0,
“number_of_pending_tasks” : 0,
“number_of_in_flight_fetch” : 0,
“task_max_waiting_in_queue_millis” : 0,
“active_shards_percent_as_number” : 100.0
}