
Hi,
This issue has had me pondering for a while now, because I can’t figure out how it happens intermittently but not in a regular way. It just happens at random.
While the server’s activities seem untouched, I have problems predicting whether the UI will be working or not when I connect.
The Issue
After upgrading graylog-server from the version 4.0.5 to the version 4.2.1 (same issue with the version 4.2.0) I found out that upon restarting the server it worked seamlessly, but for a certain period of time, then the WebUI becomes inaccessible and a blank page presents itself instead.
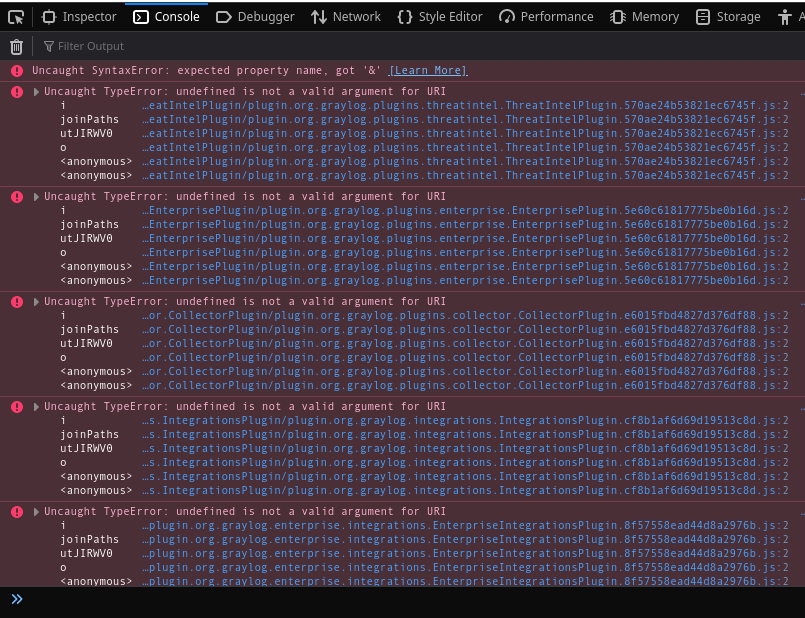
The blank page contains all the scripts, but no other <body> components:

Unfortunately this status remains for hours.
When the WebUI works as intended, no errors are thrown from the browser console. When it shows the blank page it throws a bunch of javascript errors for every installed plugin:

I really can’t figure the source of this issue out, because, as I said, sometimes it works, sometimes it doesn’t.
Environmental information
server.conf
is_master = true
node_id_file = /etc/graylog/server/node-id
password_secret = <private>
root_username = admin
root_password_sha2 = <private>
root_timezone = Europe/Rome

bin_dir = /usr/share/graylog-server/bin
data_dir = /var/lib/graylog-server
plugin_dir = /usr/share/graylog-server/plugin

http_bind_address = 192.168.37.45:9000
http_publish_uri = http://192.168.37.45:9000/

http_enable_cors = true
http_enable_gzip = true
http_max_header_size = 8192
http_thread_pool_size = 16
trusted_proxies = 127.0.0.1/32, 0:0:0:0:0:0:0:1/128

rotation_strategy = count
elasticsearch_max_docs_per_index = 20000000
elasticsearch_max_number_of_indices = 20
retention_strategy = delete
elasticsearch_shards = 4
elasticsearch_replicas = 0
elasticsearch_index_prefix = graylog
allow_leading_wildcard_searches = true
allow_highlighting = false
elasticsearch_analyzer = standard

output_batch_size = 500
output_flush_interval = 1
output_fault_count_threshold = 5
output_fault_penalty_seconds = 30
processbuffer_processors = 5
outputbuffer_processors = 3
processor_wait_strategy = blocking
ring_size = 65536
inputbuffer_ring_size = 65536
inputbuffer_processors = 2
inputbuffer_wait_strategy = blocking
message_journal_enabled = true
message_journal_dir = /var/lib/graylog-server/journal
lb_recognition_period_seconds = 3

mongodb_uri = mongodb://localhost/graylog
mongodb_max_connections = 1000
mongodb_threads_allowed_to_block_multiplier = 5

proxied_requests_thread_pool_size = 32
enabled_tls_protocols= TLSv1.1,TLSv1.2,TLSv1.3
auditlog_log4j_enabled = true
auditlog_log4j_logger_name = graylog-auditlog
server.log (from the last reboot)
2021-11-15T01:04:34.539+01:00 INFO  [ImmutableFeatureFlagsCollector] Following feature flags are used: {}
2021-11-15T01:04:41.704+01:00 INFO  [CmdLineTool] Loaded plugin: TelegramNotification 2.3.6 [de.irgendwr.TelegramNotificationPlugin]
2021-11-15T01:04:41.709+01:00 INFO  [CmdLineTool] Loaded plugin: AWS plugins 4.2.1 [org.graylog.aws.AWSPlugin]
2021-11-15T01:04:41.714+01:00 INFO  [CmdLineTool] Loaded plugin: Enterprise Integrations 4.2.1 [org.graylog.enterprise.integrations.EnterpriseIntegrationsPlugin]
2021-11-15T01:04:41.723+01:00 INFO  [CmdLineTool] Loaded plugin: Integrations 4.2.1 [org.graylog.integrations.IntegrationsPlugin]
2021-11-15T01:04:41.728+01:00 INFO  [CmdLineTool] Loaded plugin: Collector 4.2.1 [org.graylog.plugins.collector.CollectorPlugin]
2021-11-15T01:04:41.732+01:00 INFO  [CmdLineTool] Loaded plugin: Graylog Enterprise 4.2.1 [org.graylog.plugins.enterprise.EnterprisePlugin]
2021-11-15T01:04:41.737+01:00 INFO  [CmdLineTool] Loaded plugin: Graylog Enterprise (ES6 Support) 4.2.1 [org.graylog.plugins.enterprise.org.graylog.plugins.enterprise.es6.EnterpriseES6Plugin]
2021-11-15T01:04:41.741+01:00 INFO  [CmdLineTool] Loaded plugin: Graylog Enterprise (ES7 Support) 4.2.1 [org.graylog.plugins.enterprise.org.graylog.plugins.enterprise.es7.EnterpriseES7Plugin]
2021-11-15T01:04:41.746+01:00 INFO  [CmdLineTool] Loaded plugin: Threat Intelligence Plugin 4.2.1 [org.graylog.plugins.threatintel.ThreatIntelPlugin]
2021-11-15T01:04:41.755+01:00 INFO  [CmdLineTool] Loaded plugin: Elasticsearch 6 Support 4.2.1+5442e44 [org.graylog.storage.elasticsearch6.Elasticsearch6Plugin]
2021-11-15T01:04:41.761+01:00 INFO  [CmdLineTool] Loaded plugin: Elasticsearch 7 Support 4.2.1+5442e44 [org.graylog.storage.elasticsearch7.Elasticsearch7Plugin]
2021-11-15T01:04:42.211+01:00 INFO  [CmdLineTool] Running with JVM arguments: -Xms1g -Xmx1g -XX:NewRatio=1 -XX:+ResizeTLAB -XX:-OmitStackTraceInFastThrow -Djdk.tls.acknowledgeCloseNotify=true -XX:+UseConcMarkSweepGC -XX:+CMSConcurrentMTEnabled -XX:+CMSClassUnloadingEnabled -Dlog4j.configurationFile=file:///etc/graylog/server/log4j2.xml -Djava.library.path=/usr/share/graylog-server/lib/sigar -Dgraylog2.installation_source=deb
2021-11-15T01:04:43.434+01:00 INFO  [Version] HV000001: Hibernate Validator null
2021-11-15T01:05:13.163+01:00 INFO  [InputBufferImpl] Message journal is enabled.
2021-11-15T01:05:13.276+01:00 INFO  [NodeId] Node ID: 2f4965ee-d80f-4b81-beca-4aa4bb66bb37
2021-11-15T01:05:15.140+01:00 INFO  [LogManager] Loading logs.
2021-11-15T01:05:15.327+01:00 WARN  [Log] Found a corrupted index file, /var/lib/graylog-server/journal/messagejournal-0/00000000000207983642.index, deleting and rebuilding index...
2021-11-15T01:05:17.336+01:00 INFO  [LogManager] Logs loading complete.
2021-11-15T01:05:17.349+01:00 INFO  [LocalKafkaJournal] Initialized Kafka based journal at /var/lib/graylog-server/journal
2021-11-15T01:05:17.572+01:00 INFO  [cluster] Cluster created with settings {hosts=[localhost:27017], mode=SINGLE, requiredClusterType=UNKNOWN, serverSelectionTimeout='30000 ms', maxWaitQueueSize=5000}
2021-11-15T01:05:17.834+01:00 INFO  [cluster] Cluster description not yet available. Waiting for 30000 ms before timing out
2021-11-15T01:05:17.972+01:00 INFO  [connection] Opened connection [connectionId{localValue:1, serverValue:1}] to localhost:27017
2021-11-15T01:05:17.998+01:00 INFO  [cluster] Monitor thread successfully connected to server with description ServerDescription{address=localhost:27017, type=STANDALONE, state=CONNECTED, ok=true, version=ServerVersion{versionList=[4, 2, 17]}, minWireVersion=0, maxWireVersion=8, maxDocumentSize=16777216, logicalSessionTimeoutMinutes=30, roundTripTimeNanos=16926797}
2021-11-15T01:05:18.104+01:00 INFO  [connection] Opened connection [connectionId{localValue:2, serverValue:2}] to localhost:27017
2021-11-15T01:05:19.405+01:00 INFO  [InputBufferImpl] Initialized InputBufferImpl with ring size <65536> and wait strategy <BlockingWaitStrategy>, running 2 parallel message handlers.
2021-11-15T01:05:20.548+01:00 ERROR [VersionProbe] Unable to retrieve version from Elasticsearch node: Failed to connect to /127.0.0.1:9200. - Connection refused (Connection refused).
2021-11-15T01:05:25.561+01:00 ERROR [VersionProbe] Unable to retrieve version from Elasticsearch node: Failed to connect to /127.0.0.1:9200. - Connection refused (Connection refused).
2021-11-15T01:05:30.568+01:00 ERROR [VersionProbe] Unable to retrieve version from Elasticsearch node: Failed to connect to /127.0.0.1:9200. - Connection refused (Connection refused).
2021-11-15T01:05:35.573+01:00 ERROR [VersionProbe] Unable to retrieve version from Elasticsearch node: Failed to connect to /127.0.0.1:9200. - Connection refused (Connection refused).
2021-11-15T01:05:40.579+01:00 ERROR [VersionProbe] Unable to retrieve version from Elasticsearch node: Failed to connect to /127.0.0.1:9200. - Connection refused (Connection refused).
2021-11-15T01:05:46.342+01:00 INFO  [ElasticsearchVersionProvider] Elasticsearch cluster is running v7.10.2
2021-11-15T01:05:52.273+01:00 INFO  [connection] Opened connection [connectionId{localValue:3, serverValue:3}] to localhost:27017
2021-11-15T01:05:55.392+01:00 INFO  [ProcessBuffer] Initialized ProcessBuffer with ring size <65536> and wait strategy <BlockingWaitStrategy>.
2021-11-15T01:05:59.323+01:00 WARN  [GeoIpResolverEngine] GeoIP database file does not exist: /etc/graylog/server/GeoLite2-City.mmdb
2021-11-15T01:05:59.424+01:00 INFO  [OutputBuffer] Initialized OutputBuffer with ring size <65536> and wait strategy <BlockingWaitStrategy>.
2021-11-15T01:06:00.316+01:00 WARN  [GeoIpResolverEngine] GeoIP database file does not exist: /etc/graylog/server/GeoLite2-City.mmdb
2021-11-15T01:06:00.990+01:00 WARN  [GeoIpResolverEngine] GeoIP database file does not exist: /etc/graylog/server/GeoLite2-City.mmdb
2021-11-15T01:06:01.528+01:00 WARN  [GeoIpResolverEngine] GeoIP database file does not exist: /etc/graylog/server/GeoLite2-City.mmdb
2021-11-15T01:06:01.921+01:00 WARN  [GeoIpResolverEngine] GeoIP database file does not exist: /etc/graylog/server/GeoLite2-City.mmdb
2021-11-15T01:06:07.179+01:00 INFO  [graylog-auditlog] urn:graylog:node:2f4965ee-d80f-4b81-beca-4aa4bb66bb37 node startup on 2f4965ee-d80f-4b81-beca-4aa4bb66bb37 initiated - Graylog v4.2.1+5442e44
2021-11-15T01:06:07.296+01:00 INFO  [ServerBootstrap] Graylog server 4.2.1+5442e44 starting up
2021-11-15T01:06:07.297+01:00 INFO  [ServerBootstrap] JRE: Debian 11.0.12 on Linux 4.19.0-18-amd64
2021-11-15T01:06:07.298+01:00 INFO  [ServerBootstrap] Deployment: deb
2021-11-15T01:06:07.299+01:00 INFO  [ServerBootstrap] OS: Debian GNU/Linux 10 (buster) (debian)
2021-11-15T01:06:07.300+01:00 INFO  [ServerBootstrap] Arch: amd64
2021-11-15T01:06:07.547+01:00 INFO  [PeriodicalsService] Starting 37 periodicals ...
2021-11-15T01:06:07.549+01:00 INFO  [Periodicals] Starting [org.graylog2.periodical.ThroughputCalculator] periodical in [0s], polling every [1s].
2021-11-15T01:06:07.637+01:00 INFO  [Periodicals] Starting [org.graylog.plugins.pipelineprocessor.periodical.LegacyDefaultStreamMigration] periodical, running forever.
2021-11-15T01:06:07.676+01:00 INFO  [PeriodicalsService] Not starting [org.graylog2.periodical.AlertScannerThread] periodical. Not configured to run on this node.
2021-11-15T01:06:07.678+01:00 INFO  [Periodicals] Starting [org.graylog2.periodical.BatchedElasticSearchOutputFlushThread] periodical in [0s], polling every [1s].
2021-11-15T01:06:07.680+01:00 INFO  [Periodicals] Starting [org.graylog2.periodical.ClusterHealthCheckThread] periodical in [120s], polling every [20s].
2021-11-15T01:06:07.724+01:00 INFO  [PeriodicalsService] Not starting [org.graylog2.periodical.ContentPackLoaderPeriodical] periodical. Not configured to run on this node.
2021-11-15T01:06:07.725+01:00 INFO  [Periodicals] Starting [org.graylog2.periodical.GarbageCollectionWarningThread] periodical, running forever.
2021-11-15T01:06:07.729+01:00 INFO  [Periodicals] Starting [org.graylog2.periodical.IndexerClusterCheckerThread] periodical in [0s], polling every [30s].
2021-11-15T01:06:07.757+01:00 INFO  [Periodicals] Starting [org.graylog2.periodical.IndexRetentionThread] periodical in [0s], polling every [300s].
2021-11-15T01:06:07.782+01:00 INFO  [Periodicals] Starting [org.graylog2.periodical.IndexRotationThread] periodical in [0s], polling every [10s].
2021-11-15T01:06:07.788+01:00 INFO  [LegacyDefaultStreamMigration] Legacy default stream has no connections, no migration needed.
2021-11-15T01:06:07.843+01:00 INFO  [Periodicals] Starting [org.graylog2.periodical.NodePingThread] periodical in [0s], polling every [1s].
2021-11-15T01:06:07.845+01:00 INFO  [Periodicals] Starting [org.graylog2.periodical.VersionCheckThread] periodical in [300s], polling every [1800s].
2021-11-15T01:06:07.863+01:00 INFO  [Periodicals] Starting [org.graylog2.periodical.ThrottleStateUpdaterThread] periodical in [1s], polling every [1s].
2021-11-15T01:06:07.870+01:00 INFO  [Periodicals] Starting [org.graylog2.events.ClusterEventPeriodical] periodical in [0s], polling every [1s].
2021-11-15T01:06:07.873+01:00 INFO  [Periodicals] Starting [org.graylog2.events.ClusterEventCleanupPeriodical] periodical in [0s], polling every [86400s].
2021-11-15T01:06:07.875+01:00 INFO  [Periodicals] Starting [org.graylog2.periodical.ClusterIdGeneratorPeriodical] periodical, running forever.
2021-11-15T01:06:07.880+01:00 INFO  [connection] Opened connection [connectionId{localValue:4, serverValue:4}] to localhost:27017
2021-11-15T01:06:07.895+01:00 INFO  [Periodicals] Starting [org.graylog2.periodical.IndexRangesMigrationPeriodical] periodical, running forever.
2021-11-15T01:06:07.911+01:00 INFO  [Periodicals] Starting [org.graylog2.periodical.IndexRangesCleanupPeriodical] periodical in [15s], polling every [3600s].
2021-11-15T01:06:07.958+01:00 INFO  [connection] Opened connection [connectionId{localValue:5, serverValue:5}] to localhost:27017
2021-11-15T01:06:08.030+01:00 INFO  [connection] Opened connection [connectionId{localValue:7, serverValue:7}] to localhost:27017
2021-11-15T01:06:08.051+01:00 INFO  [connection] Opened connection [connectionId{localValue:9, serverValue:9}] to localhost:27017
2021-11-15T01:06:08.020+01:00 INFO  [connection] Opened connection [connectionId{localValue:6, serverValue:6}] to localhost:27017
2021-11-15T01:06:08.083+01:00 INFO  [connection] Opened connection [connectionId{localValue:8, serverValue:8}] to localhost:27017
2021-11-15T01:06:08.279+01:00 INFO  [PeriodicalsService] Not starting [org.graylog2.periodical.UserPermissionMigrationPeriodical] periodical. Not configured to run on this node.
2021-11-15T01:06:08.280+01:00 INFO  [Periodicals] Starting [org.graylog2.periodical.ConfigurationManagementPeriodical] periodical, running forever.
2021-11-15T01:06:08.305+01:00 INFO  [Periodicals] Starting [org.graylog2.periodical.TrafficCounterCalculator] periodical in [0s], polling every [1s].
2021-11-15T01:06:08.307+01:00 INFO  [Periodicals] Starting [org.graylog2.indexer.fieldtypes.IndexFieldTypePollerPeriodical] periodical in [0s], polling every [3600s].
2021-11-15T01:06:08.308+01:00 INFO  [Periodicals] Starting [org.graylog.scheduler.periodicals.ScheduleTriggerCleanUp] periodical in [120s], polling every [86400s].
2021-11-15T01:06:08.309+01:00 INFO  [Periodicals] Starting [org.graylog2.periodical.ESVersionCheckPeriodical] periodical in [0s], polling every [30s].
2021-11-15T01:06:08.310+01:00 INFO  [Periodicals] Starting [org.graylog.plugins.sidecar.periodical.PurgeExpiredSidecarsThread] periodical in [0s], polling every [600s].
2021-11-15T01:06:08.310+01:00 INFO  [Periodicals] Starting [org.graylog.plugins.sidecar.periodical.PurgeExpiredConfigurationUploads] periodical in [0s], polling every [600s].
2021-11-15T01:06:08.366+01:00 INFO  [Periodicals] Starting [org.graylog.plugins.views.search.db.SearchesCleanUpJob] periodical in [3600s], polling every [28800s].
2021-11-15T01:06:08.477+01:00 INFO  [Periodicals] Starting [org.graylog.events.periodicals.EventNotificationStatusCleanUp] periodical in [120s], polling every [86400s].
2021-11-15T01:06:08.478+01:00 INFO  [Periodicals] Starting [org.graylog.plugins.collector.periodical.PurgeExpiredCollectorsThread] periodical in [0s], polling every [3600s].
2021-11-15T01:06:08.479+01:00 INFO  [Periodicals] Starting [org.graylog.plugins.forwarder.ForwarderStatePeriodical] periodical in [0s], polling every [15s].
2021-11-15T01:06:08.498+01:00 INFO  [Periodicals] Starting [org.graylog.plugins.license.LicenseManagerPeriodical] periodical in [0s], polling every [300s].
2021-11-15T01:06:08.538+01:00 INFO  [Periodicals] Starting [org.graylog.plugins.license.LicenseReportPeriodical] periodical in [300s], polling every [3600s].
2021-11-15T01:06:08.563+01:00 INFO  [Periodicals] Starting [org.graylog.plugins.license.StagedLicenseInstallerPeriodical] periodical, running forever.
2021-11-15T01:06:08.620+01:00 INFO  [Periodicals] Starting [org.graylog.plugins.auditlog.mongodb.MongoAuditLogPeriodical] periodical in [0s], polling every [3600s].
2021-11-15T01:06:08.667+01:00 INFO  [Periodicals] Starting [org.graylog.plugins.report.scheduler.ReportPeriodical] periodical in [120s], polling every [60s].
2021-11-15T01:06:08.673+01:00 INFO  [Periodicals] Starting [org.graylog.plugins.report.service.ChromeDriverCleanupPeriodical] periodical in [60s], polling every [180s].
2021-11-15T01:06:08.786+01:00 INFO  [LookupTableService] Data Adapter watchlist-mongo/61901db34d93d945cb9a70a0 [@5d635da0] STARTING
2021-11-15T01:06:08.789+01:00 INFO  [Periodicals] Starting [org.graylog.plugins.files.CleanupPeriodical] periodical in [0s], polling every [86400s].
2021-11-15T01:06:08.795+01:00 INFO  [LookupTableService] Data Adapter mac-ssid/602961387b867f0b9b165257 [@5ca767bd] STARTING
2021-11-15T01:06:08.796+01:00 INFO  [LookupTableService] Data Adapter network-aliases/5fc41b5adec571151748b6b4 [@4da9aba0] STARTING
2021-11-15T01:06:09.795+01:00 INFO  [LookupTableService] Data Adapter ssids/5fbaadc2588a9a48ea9db9b9 [@4a925457] STARTING
2021-11-15T01:06:09.798+01:00 INFO  [LookupTableService] Data Adapter interface-names/5fc421bddec571151748be22 [@13a39d43] STARTING
2021-11-15T01:06:09.803+01:00 INFO  [LookupTableService] Data Adapter subnets/5fbad765588a9a48ea9dea63 [@154175b3] STARTING
2021-11-15T01:06:09.813+01:00 INFO  [LookupTableService] Data Adapter mac-address/5fbab426588a9a48ea9dc2bd [@7816fbb9] STARTING
2021-11-15T01:06:09.846+01:00 INFO  [LookupTableService] Data Adapter watchlist-mongo/61901db34d93d945cb9a70a0 [@5d635da0] RUNNING
2021-11-15T01:06:09.878+01:00 INFO  [LookupTableService] Data Adapter ssids/5fbaadc2588a9a48ea9db9b9 [@4a925457] RUNNING
2021-11-15T01:06:09.880+01:00 INFO  [LookupDataAdapterRefreshService] Adding job for <ssids/5fbaadc2588a9a48ea9db9b9/@4a925457> [interval=60000ms]
2021-11-15T01:06:09.902+01:00 INFO  [LookupTableService] Data Adapter interface-names/5fc421bddec571151748be22 [@13a39d43] RUNNING
2021-11-15T01:06:09.904+01:00 INFO  [LookupTableService] Data Adapter mac-ssid/602961387b867f0b9b165257 [@5ca767bd] RUNNING
2021-11-15T01:06:09.930+01:00 INFO  [LookupDataAdapterRefreshService] Adding job for <mac-ssid/602961387b867f0b9b165257/@5ca767bd> [interval=60000ms]
2021-11-15T01:06:09.932+01:00 INFO  [LookupDataAdapterRefreshService] Adding job for <interface-names/5fc421bddec571151748be22/@13a39d43> [interval=60000ms]
2021-11-15T01:06:09.971+01:00 INFO  [LookupTableService] Data Adapter mac-address/5fbab426588a9a48ea9dc2bd [@7816fbb9] RUNNING
2021-11-15T01:06:09.972+01:00 INFO  [LookupDataAdapterRefreshService] Adding job for <mac-address/5fbab426588a9a48ea9dc2bd/@7816fbb9> [interval=60000ms]
2021-11-15T01:06:10.091+01:00 INFO  [LookupTableService] Data Adapter subnets/5fbad765588a9a48ea9dea63 [@154175b3] RUNNING
2021-11-15T01:06:10.092+01:00 INFO  [LookupDataAdapterRefreshService] Adding job for <subnets/5fbad765588a9a48ea9dea63/@154175b3> [interval=60000ms]
2021-11-15T01:06:10.463+01:00 INFO  [LookupTableService] Data Adapter network-aliases/5fc41b5adec571151748b6b4 [@4da9aba0] RUNNING
2021-11-15T01:06:10.464+01:00 INFO  [LookupDataAdapterRefreshService] Adding job for <network-aliases/5fc41b5adec571151748b6b4/@4da9aba0> [interval=60000ms]
2021-11-15T01:06:10.849+01:00 INFO  [LookupTableService] Cache watchlist-cache/61901db34d93d945cb9a709e [@75f361e3] STARTING
2021-11-15T01:06:10.856+01:00 INFO  [LookupTableService] Cache watchlist-cache/61901db34d93d945cb9a709e [@75f361e3] RUNNING
2021-11-15T01:06:10.851+01:00 INFO  [LookupTableService] Cache no-cache/5fbaae33588a9a48ea9dba3e [@1f55441c] STARTING
2021-11-15T01:06:10.873+01:00 INFO  [LookupTableService] Cache no-cache/5fbaae33588a9a48ea9dba3e [@1f55441c] RUNNING
2021-11-15T01:06:10.926+01:00 INFO  [LookupTableService] Starting lookup table SSIDs lookup/5fbaae4b588a9a48ea9dba5b [@4f131e29] using cache no-cache/5fbaae33588a9a48ea9dba3e [@1f55441c], data adapter ssids/5fbaadc2588a9a48ea9db9b9 [@4a925457]
2021-11-15T01:06:10.927+01:00 INFO  [LookupTableService] Starting lookup table MAC Address/5fbab464588a9a48ea9dc304 [@7a4f0950] using cache no-cache/5fbaae33588a9a48ea9dba3e [@1f55441c], data adapter mac-address/5fbab426588a9a48ea9dc2bd [@7816fbb9]
2021-11-15T01:06:10.928+01:00 INFO  [LookupTableService] Starting lookup table Subnet Lookup/5fbad792588a9a48ea9dea97 [@56d7bbaa] using cache no-cache/5fbaae33588a9a48ea9dba3e [@1f55441c], data adapter subnets/5fbad765588a9a48ea9dea63 [@154175b3]
2021-11-15T01:06:10.930+01:00 INFO  [LookupTableService] Starting lookup table Net Alias Lookup/5fc41bc0dec571151748b725 [@3a4e207] using cache no-cache/5fbaae33588a9a48ea9dba3e [@1f55441c], data adapter network-aliases/5fc41b5adec571151748b6b4 [@4da9aba0]
2021-11-15T01:06:10.931+01:00 INFO  [LookupTableService] Starting lookup table Interface Names Lookup/5fc421f3dec571151748be61 [@5491560c] using cache no-cache/5fbaae33588a9a48ea9dba3e [@1f55441c], data adapter interface-names/5fc421bddec571151748be22 [@13a39d43]
2021-11-15T01:06:10.940+01:00 INFO  [LookupTableService] Starting lookup table MAC-SSID/602961b87b867f0b9b1652e3 [@5616c047] using cache no-cache/5fbaae33588a9a48ea9dba3e [@1f55441c], data adapter mac-ssid/602961387b867f0b9b165257 [@5ca767bd]
2021-11-15T01:06:10.942+01:00 INFO  [LookupTableService] Starting lookup table watchlist/61901db34d93d945cb9a70a2 [@3df72bc4] using cache watchlist-cache/61901db34d93d945cb9a709e [@75f361e3], data adapter watchlist-mongo/61901db34d93d945cb9a70a0 [@5d635da0]
2021-11-15T01:06:12.140+01:00 INFO  [IndexRetentionThread] Elasticsearch cluster not available, skipping index retention checks.
2021-11-15T01:06:15.571+01:00 INFO  [JerseyService] Enabling CORS for HTTP endpoint
2021-11-15T01:06:23.281+01:00 INFO  [IndexRangesCleanupPeriodical] Skipping index range cleanup because the Elasticsearch cluster is unreachable or unhealthy
2021-11-15T01:06:43.824+01:00 INFO  [JerseyService] Started REST API at <192.168.37.45:9000>
2021-11-15T01:06:43.836+01:00 INFO  [ServerBootstrap] Services started, startup times in ms: {FailureHandlingService [RUNNING]=65, InputSetupService [RUNNING]=101, LocalKafkaMessageQueueWriter [RUNNING]=148, GracefulShutdownService [RUNNING]=160, BufferSynchronizerService [RUNNING]=209, UrlWhitelistService [RUNNING]=235, LocalKafkaMessageQueueReader [RUNNING]=249, DevelopmentDirectoryObserverService [RUNNING]=260, UserSessionTerminationService [RUNNING]=304, PrometheusExporter [RUNNING]=343, JobSchedulerService [RUNNING]=346, OutputSetupService [RUNNING]=380, LocalKafkaJournal [RUNNING]=432, EtagService [RUNNING]=439, ConfigurationEtagService [RUNNING]=443, ProcessingConfigurationManager [RUNNING]=457, MongoDBProcessingStatusRecorderService [RUNNING]=553, StreamCacheService [RUNNING]=843, PeriodicalsService [RUNNING]=1313, LookupTableService [RUNNING]=3385, JerseyService [RUNNING]=36330}
2021-11-15T01:06:43.848+01:00 INFO  [ServiceManagerListener] Services are healthy
2021-11-15T01:06:43.862+01:00 INFO  [InputSetupService] Triggering launching persisted inputs, node transitioned from Uninitialized [LB:DEAD] to Running [LB:ALIVE]
2021-11-15T01:06:43.990+01:00 WARN  [JobExecutionEngine] Force-released 1 stale job triggers after an unclean job scheduler shutdown
2021-11-15T01:06:44.054+01:00 INFO  [ServerBootstrap] Graylog server up and running.
2021-11-15T01:06:44.058+01:00 INFO  [graylog-auditlog] urn:graylog:node:2f4965ee-d80f-4b81-beca-4aa4bb66bb37 node startup on 2f4965ee-d80f-4b81-beca-4aa4bb66bb37 complete - Graylog v4.2.1+5442e44
2021-11-15T01:06:44.095+01:00 INFO  [InputStateListener] Input [Syslog UDP/5f7884a5add27a240130b7a7] is now STARTING
2021-11-15T01:06:44.115+01:00 INFO  [InputStateListener] Input [GELF UDP/5f802e45bea61154cfb4cbf1] is now STARTING
2021-11-15T01:06:44.124+01:00 INFO  [InputStateListener] Input [Syslog UDP/5f8308e4d7903a2540d4a198] is now STARTING
2021-11-15T01:06:44.133+01:00 INFO  [InputStateListener] Input [Syslog UDP/5f86b8fbd7903a2540d943c8] is now STARTING
2021-11-15T01:06:44.140+01:00 INFO  [InputStateListener] Input [Syslog UDP/5f86b9a9d7903a2540d94507] is now STARTING
2021-11-15T01:06:44.155+01:00 INFO  [InputStateListener] Input [Syslog UDP/5f87159c014cea1d0d56c2e0] is now STARTING
2021-11-15T01:06:44.161+01:00 INFO  [InputStateListener] Input [Syslog UDP/5f9ecadc4687dd05f6c1d0eb] is now STARTING
2021-11-15T01:06:44.166+01:00 INFO  [InputStateListener] Input [GELF UDP/5f8cc561d7f89e1d858eaa77] is now STARTING
2021-11-15T01:06:44.183+01:00 INFO  [InputStateListener] Input [Syslog UDP/5f9f0f674687dd05f6c25d61] is now STARTING
2021-11-15T01:06:44.660+01:00 INFO  [connection] Opened connection [connectionId{localValue:11, serverValue:11}] to localhost:27017
2021-11-15T01:06:44.664+01:00 INFO  [connection] Opened connection [connectionId{localValue:10, serverValue:10}] to localhost:27017
2021-11-15T01:06:44.702+01:00 INFO  [connection] Opened connection [connectionId{localValue:12, serverValue:12}] to localhost:27017
2021-11-15T01:06:44.709+01:00 INFO  [InputStateListener] Input [GELF UDP/6048c91c5690fc59a9739f2f] is now STARTING
2021-11-15T01:06:44.754+01:00 INFO  [connection] Opened connection [connectionId{localValue:13, serverValue:13}] to localhost:27017
2021-11-15T01:06:45.458+01:00 WARN  [UdpTransport] receiveBufferSize (SO_RCVBUF) for input SyslogUDPInput{title=chidi/trinacria, type=org.graylog2.inputs.syslog.udp.SyslogUDPInput, nodeId=2f4965ee-d80f-4b81-beca-4aa4bb66bb37} (channel [id: 0x0bbeafd3, L:/0:0:0:0:0:0:0:0%0:1507]) should be >= 1048576 but is 425984.
2021-11-15T01:06:45.460+01:00 WARN  [UdpTransport] receiveBufferSize (SO_RCVBUF) for input SyslogUDPInput{title=chidi/trinacria, type=org.graylog2.inputs.syslog.udp.SyslogUDPInput, nodeId=2f4965ee-d80f-4b81-beca-4aa4bb66bb37} (channel [id: 0xb8beb9a1, L:/0:0:0:0:0:0:0:0%0:1507]) should be >= 1048576 but is 425984.
2021-11-15T01:06:45.490+01:00 WARN  [UdpTransport] receiveBufferSize (SO_RCVBUF) for input SyslogUDPInput{title=chidi/trinacria, type=org.graylog2.inputs.syslog.udp.SyslogUDPInput, nodeId=2f4965ee-d80f-4b81-beca-4aa4bb66bb37} (channel [id: 0xe78da404, L:/0:0:0:0:0:0:0:0%0:1507]) should be >= 1048576 but is 425984.
2021-11-15T01:06:45.518+01:00 INFO  [InputStateListener] Input [GELF UDP/5f802e45bea61154cfb4cbf1] is now RUNNING
2021-11-15T01:06:45.541+01:00 INFO  [InputStateListener] Input [Syslog UDP/5f7884a5add27a240130b7a7] is now RUNNING
2021-11-15T01:06:45.563+01:00 INFO  [InputStateListener] Input [Syslog UDP/5f9f0f674687dd05f6c25d61] is now RUNNING
2021-11-15T01:06:45.760+01:00 WARN  [UdpTransport] receiveBufferSize (SO_RCVBUF) for input SyslogUDPInput{title=chidi/trinacria, type=org.graylog2.inputs.syslog.udp.SyslogUDPInput, nodeId=2f4965ee-d80f-4b81-beca-4aa4bb66bb37} (channel [id: 0x138f2c06, L:/0:0:0:0:0:0:0:0%0:1507]) should be >= 1048576 but is 425984.
2021-11-15T01:06:45.856+01:00 INFO  [InputStateListener] Input [Syslog UDP/5f8308e4d7903a2540d4a198] is now RUNNING
2021-11-15T01:06:45.912+01:00 INFO  [InputStateListener] Input [GELF UDP/5f8cc561d7f89e1d858eaa77] is now RUNNING
2021-11-15T01:06:45.932+01:00 INFO  [InputStateListener] Input [Syslog UDP/5f86b8fbd7903a2540d943c8] is now RUNNING
2021-11-15T01:06:45.941+01:00 INFO  [InputStateListener] Input [Syslog UDP/5f87159c014cea1d0d56c2e0] is now RUNNING
2021-11-15T01:06:45.973+01:00 INFO  [InputStateListener] Input [Syslog UDP/5f9ecadc4687dd05f6c1d0eb] is now RUNNING
2021-11-15T01:06:45.982+01:00 INFO  [InputStateListener] Input [Syslog UDP/5f86b9a9d7903a2540d94507] is now RUNNING
2021-11-15T01:06:46.032+01:00 INFO  [InputStateListener] Input [GELF UDP/6048c91c5690fc59a9739f2f] is now RUNNING
2021-11-15T02:11:10.921+01:00 INFO  [graylog-auditlog] urn:graylog:node:2f4965ee-d80f-4b81-beca-4aa4bb66bb37 Elasticsearch index range for index "dns_63" deleted
2021-11-15T18:40:24.606+01:00 INFO  [graylog-auditlog] urn:graylog:user:ema session created (from 192.168.37.45)
2021-11-15T18:40:35.243+01:00 INFO  [graylog-auditlog] urn:graylog:user:ema search 61929c2d6564c65444d9bd3f created
2021-11-15T18:40:36.246+01:00 INFO  [graylog-auditlog] urn:graylog:user:ema search job 61929b94a67e764a68832799 for search 61929c2d6564c65444d9bd3f created
Operating system information
Graylog 4.2.1+5442e44 on graylog.private (Debian 11.0.12 on Linux 4.19.0-18-amd64)
Package versions
- Graylog - 4.2.1
- MongoDB - 4.2.17
- Elasticsearch - 7.10.2
- Apache (reverse proxy) - Apache/2.4.38 (Debian)
