Before you post: Your responses to these questions will help the community help you. Please complete this template if you’re asking a support question. Don’t forget to select tags to help index your topic!
1. Describe your incident:
I have graylog 4.3 working with elasticsearch 7.9.3 and I am trying use grafana 8.5.21 in another machine but doesn´t work…
2. Describe your environment:
OS Information:debian 11
Package Version: bulleye
Service logs, configurations, and environment variables:
in the middle of the grafana server and elasticsearch there is a proxy.
3. What steps have you already taken to try and solve the problem?
edit the /etc/elasticsearch/elasticsearch.yml putting network.host and http port but elasticsearch service makes an error, putting back with # all works again and Idid not make anything more.
4. How can the community help?
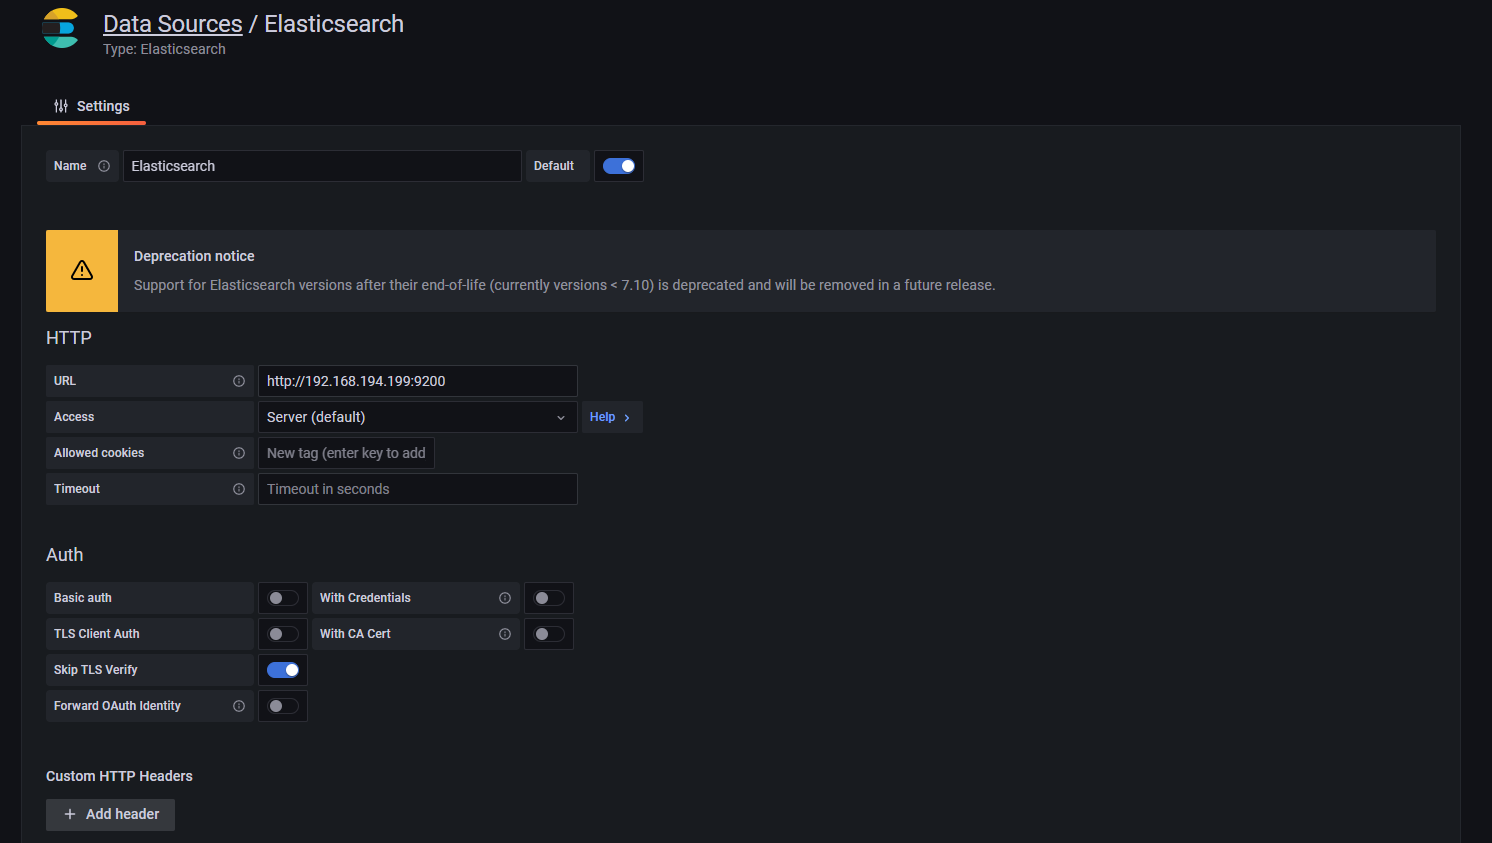
configuration of grafana to connect elasticsearch in another machine (not local host) I am going to prove to do it in local host.
I am pretty sure that unless you have set up protection for Elasticsearch, it is open to anything connecting to it. so no protection means Grafana should be able to query Elasticsearch databases easily.
It’ not clear where the issue is, you may need to post more specific data on what you are doing and what error you are seeing. Also, this may be a Grafana config error… at which point this isn’t the right forum… though someone may help anyway…
I have the same setup. Since its over the network Elasticsearch can not be 0.0.0.0 or loopback address Localhost.If so then using a Nginx and/or apache for routing. Which mean you may want to secure it but might run into issue with Graylog. I have my setup inclosed so its not opened to the World,
the elastic server(graylog) is 192.168.194.199 and the grafana is in 192.168.194.213 all works in debian 11 in virtualbox in the same windows host win 10.
if anybody needs anythibgmore please tell me about.
One of your errors is a “Bad Gateway” this would be your network configurations probably. Ports, Firewalls and/or you Elasticsearch yaml file network config. So knowning that is work on Graylog server and not remotely make me think that you may have Elasticsearch config set as localhost or 127.0.0.1.