
1. Describe your incident:
This is frustrating!
A new cluster (2x GL + 3x OpenSearch) deployed on Azure cannot cope with the load that a single GL instance, also on Azure, handles.
2. Describe your environment:
-
OS Information: Ubuntu 20.04 LTS
-
Package Version:
GL 4.3.5
OS: 1.3.3 -
Service logs, configurations, and environment variables:
Each GL node (x2) has 16 GB RAM, 8 vCPUs
Each OS node (x3) has 16 GB RAM, 8 vCPUs
/etc/graylog/server/server.conf
$ grep -v \# /etc/graylog/server/server.conf | uniq

is_master = true

node_id_file = /etc/graylog/server/node-id

password_secret = XXXXXXXXXXXXXXXXXXXXXXXXXXXXX

root_password_sha2 = XXXXXXXXXXXXXXXXXXXXXXXXXXXXX

root_email = "email@domain.tld"

bin_dir = /usr/share/graylog-server/bin

data_dir = /var/lib/graylog-server

plugin_dir = /usr/share/graylog-server/plugin

http_bind_address = 0.0.0.0:9000

elasticsearch_version = 7

trusted_proxies = 127.0.0.1/32, 1.2.3.4/32

elasticsearch_hosts = http://admin:admin@node-1:9200,http://admin:admin@node-2:9200,http://admin:admin@node-3:9200

rotation_strategy = count

elasticsearch_max_docs_per_index = 20000000

elasticsearch_max_number_of_indices = 20

retention_strategy = delete

elasticsearch_shards = 4
elasticsearch_replicas = 0

elasticsearch_index_prefix = graylog

allow_leading_wildcard_searches = true

allow_highlighting = false

elasticsearch_analyzer = standard

elasticsearch_index_optimization_jobs = 30

output_batch_size = 5000

output_flush_interval = 1

output_fault_count_threshold = 5
output_fault_penalty_seconds = 30

processbuffer_processors = 2
outputbuffer_processors = 2

processor_wait_strategy = blocking

ring_size = 65536

inputbuffer_ring_size = 65536
inputbuffer_processors = 2
inputbuffer_wait_strategy = blocking

message_journal_enabled = true

message_journal_dir = /var/lib/graylog-server/journal

message_journal_max_age = 12h
message_journal_max_size = 10gb

lb_recognition_period_seconds = 3

mongodb_uri = mongodb://mongodb-node:27017/graylog

mongodb_max_connections = 1000

mongodb_threads_allowed_to_block_multiplier = 5

proxied_requests_thread_pool_size = 32

prometheus_exporter_enabled = true

prometheus_exporter_bind_address = 127.0.0.1:9090
/etc/default/graylog-server
$ cat /etc/default/graylog-server
# Path to the java executable.
JAVA=/usr/bin/java

# Default Java options for heap and garbage collection.
GRAYLOG_SERVER_JAVA_OPTS="-Xms4096m -Xms4096m -XX:NewRatio=1 -server -XX:+ResizeTLAB -XX:-OmitStackTraceInFastThrow"

# Avoid endless loop with some TLSv1.3 implementations.
GRAYLOG_SERVER_JAVA_OPTS="$GRAYLOG_SERVER_JAVA_OPTS -Djdk.tls.acknowledgeCloseNotify=true"

# Fix for log4j CVE-2021-44228
GRAYLOG_SERVER_JAVA_OPTS="$GRAYLOG_SERVER_JAVA_OPTS -Dlog4j2.formatMsgNoLookups=true"

# Pass some extra args to graylog-server. (i.e. "-d" to enable debug mode)
GRAYLOG_SERVER_ARGS=""

# Program that will be used to wrap the graylog-server command. Useful to
# support programs like authbind.
GRAYLOG_COMMAND_WRAPPER=""
/etc/opensearch/opensearch.yml
$ grep -v \# /etc/opensearch/opensearch.yml
path.data: /data/opensearch
path.logs: /var/log/opensearch

plugins.security.disabled: true
plugins.security.ssl.transport.pemcert_filepath: cert.pem
plugins.security.ssl.transport.pemkey_filepath: cert.key
plugins.security.ssl.transport.pemtrustedcas_filepath: root-ca.pem
plugins.security.ssl.transport.enforce_hostname_verification: false
plugins.security.ssl.http.enabled: false
plugins.security.ssl.http.pemcert_filepath: cert.pem
plugins.security.ssl.http.pemkey_filepath: cert.key
plugins.security.ssl.http.pemtrustedcas_filepath: root-ca.pem
plugins.security.allow_unsafe_democertificates: true
plugins.security.allow_default_init_securityindex: true

[ LDAP stuff removed ]

plugins.security.audit.type: internal_opensearch
plugins.security.enable_snapshot_restore_privilege: true
plugins.security.check_snapshot_restore_write_privileges: true
plugins.security.restapi.roles_enabled: ["all_access", "security_rest_api_access"]
plugins.security.system_indices.enabled: true
plugins.security.system_indices.indices: [".plugins-ml-model", ".plugins-ml-task", ".opendistro-alerting-config", ".opendistro-alerting-alert*", ".opendistro-anomaly-results*", ".opendistro-anomaly-detector*", ".opendistro-anomaly-checkpoints", ".opendistro-anomaly-detection-state", ".opendistro-reports-*", ".opensearch-notifications-*", ".opensearch-notebooks", ".opensearch-observability", ".opendistro-asynchronous-search-response*", ".replication-metadata-store"]
node.max_local_storage_nodes: 3
cluster.name: "opensearch-cluster"

node.name: "node1"

network.host: "1.2.3.4"

http.port: 9200

bootstrap.memory_lock: true

discovery.seed_hosts: ["node-1","node-2","node-3"]

cluster.initial_master_nodes: ["node-1"]

node.roles: ['data', 'master']
The main issue:

The funny part:

which seems to match with:
$ curl http://$(hostname):9200/_cluster/health?pretty=true
{
  "cluster_name" : "opensearch-cluster",
  "status" : "green",
  "timed_out" : false,
  "number_of_nodes" : 3,
  "number_of_data_nodes" : 3,
  "discovered_master" : true,
  "active_primary_shards" : 733,
  "active_shards" : 755,
  "relocating_shards" : 0,
  "initializing_shards" : 0,
  "unassigned_shards" : 0,
  "delayed_unassigned_shards" : 0,
  "number_of_pending_tasks" : 0,
  "number_of_in_flight_fetch" : 0,
  "task_max_waiting_in_queue_millis" : 0,
  "active_shards_percent_as_number" : 100.0
}
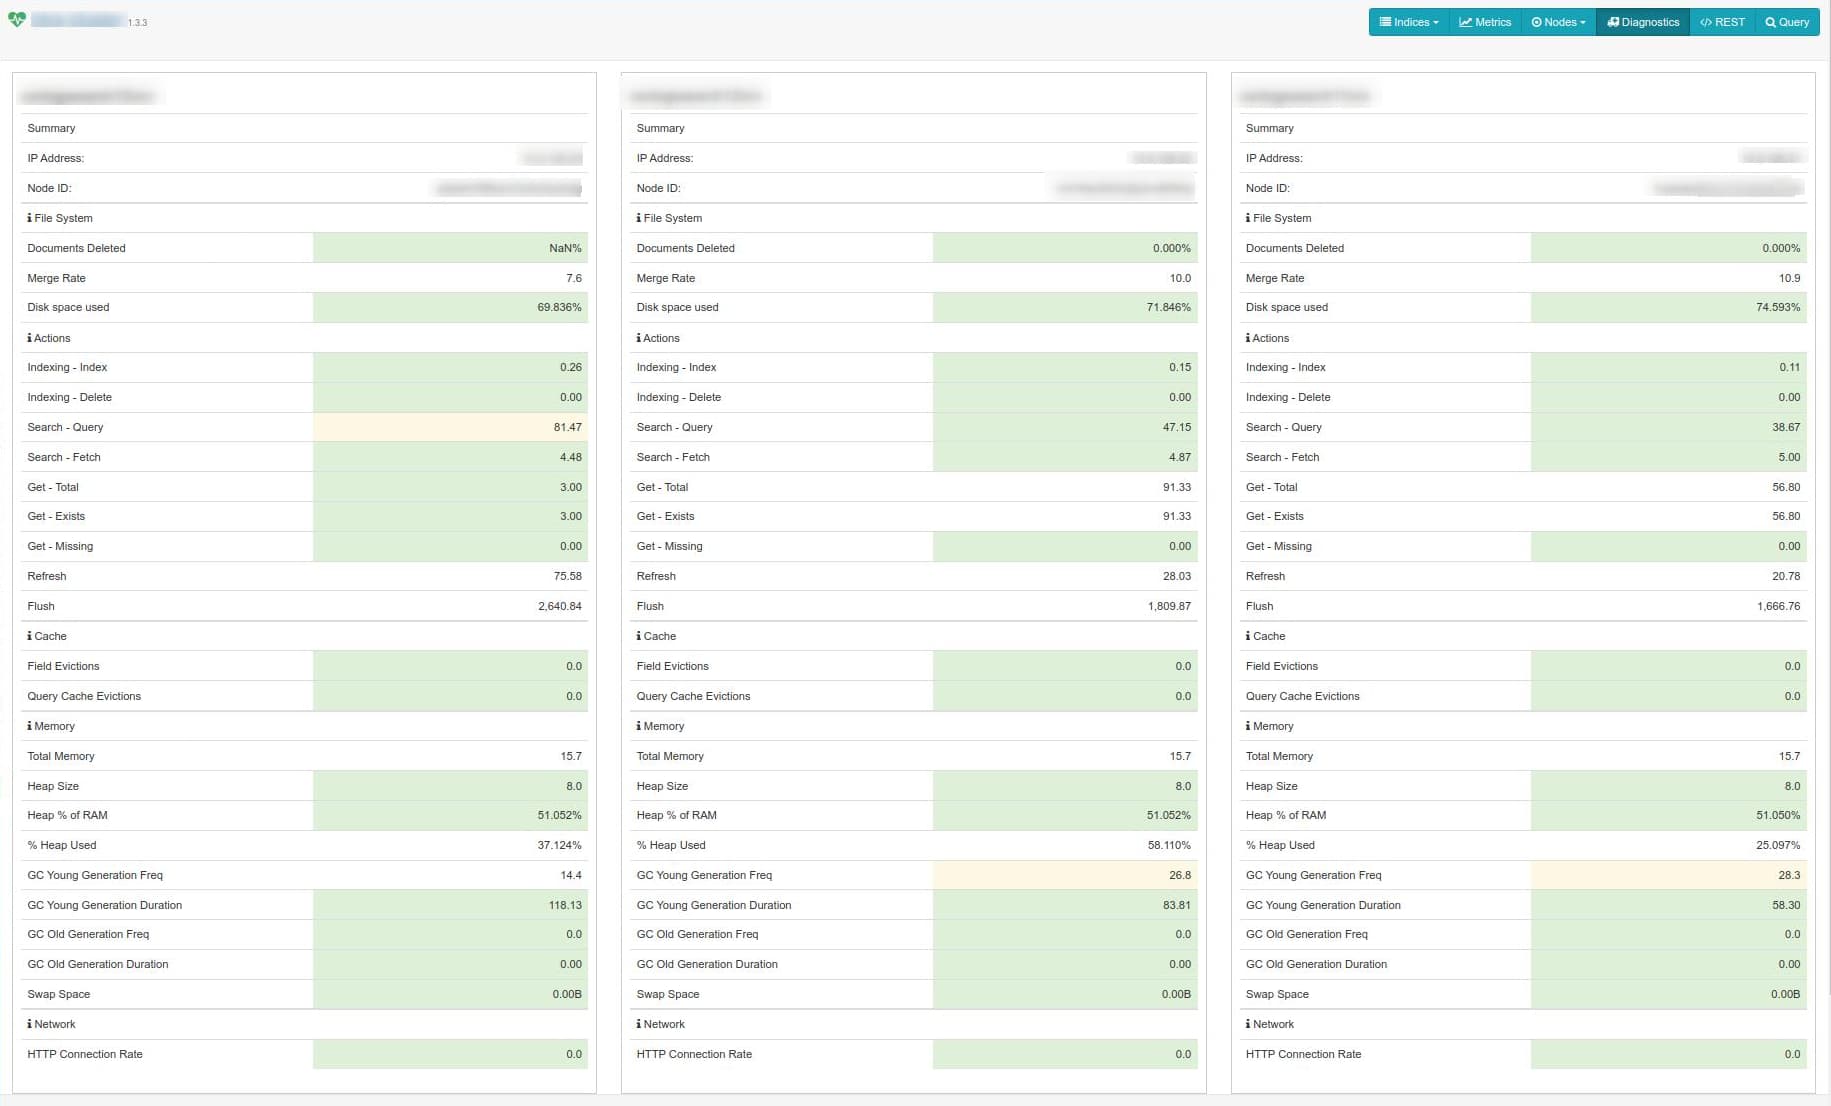
I installed ElasticHQ and, overall, things look good:
I read almost every entry about this topic I found on the forum and applied the proposed solutions but no luck…
This is the current situation:

This is similar on both GL nodes:

where millions of mesages are unprocessed and the main “Search” page or the “Sources” dashboard are not showing anything either…
The most worrying parts are:
- not all applications are sending their logs to the new cluster, so there’s more load to come…
- the old Graylog 3.2.6 VM (32 GB RAM, 16 vCPUs) could, single-handed, deal with more load than the current clustered version
3. What steps have you already taken to try and solve the problem?
Read the docs, read the forum, applied solutions proposed.
4. How can the community help?
First of all, I would like to reach a battle-proof state with this cluster based on GL+OS. Nowadays it is not, despite all the resources…
Does the fact that 2x GL nodes and 3x OS nodes are deployed could be a bottleneck by having 1 GL node less? In other words: would a 3x GL + 3x OS cluster solve the issue?
Are there any settings I should fine-tune?
Does the cluster need to be beefed up with more resources? if so, RAM? CPU?
Thanks a lot in advance for your assistance!
Best regards