I send long log messages to a stream. These logs each contains many lines that we cannot split.
When I open (click) a specific log, I can see all its lines in the message field, correctly formatted with carriage returns.
But when I chose to display the message field as a column of the table, the carriage returns are deleted, thus everything is on one line. Which is complex to read in this case.
If I edit the table and I enable MESSAGE PREVIEW > Show message in new row. The formatting is correctly conserved with the carriage returns, but it’s only a preview, so only 4 lines are displayed in the new row.
Is it possible to either display the carriage returns in the message field of the table, or to display the complete log message in the preview row ?
\The widget should appear then try to edit it again, If that doesn’t work I’m not sure.
Maybe permission issue or some type of configuration issue is hard to tell.
So in that post GL version was 3.2 and you stated this version is Graylog 4.3.2+313b6bc. I have a weird feeling that not all your plugins were upgrade to the correct version, or something on how the upgrade was executed.
Yes I’m in the same menu as you are, quite strange indeed.
I’ve tried to delete the message widget and create it back, but the checkbox is still missing.
My graylog instance is new and has directly been installed with v4.3.2+313b6bc.
I don’t have any plugins. I’ve only installed the MaxMind GeoIP integration.
If not, I would probably do that and restart Graylog service see if that helps.
I forgot to ask, what documentation did you use to install Graylog? Also what version of Elasticsearch and MongoDb are you using?
I would like to bring in another approach to this issue:
Parse your messages, that they become machine readable and add the fields of interest to the table. This has the advantage, that you easily can build dashboards and alerts. You can add as many fields to the table as you like, as long as the content fits in one row.
I followed the CentOS installation procedure from the official docs using yum/dnf.
I’m not so sure I installed the graylog-integrations-plugins package, as this line is missing when comparing you screenshot and mine.
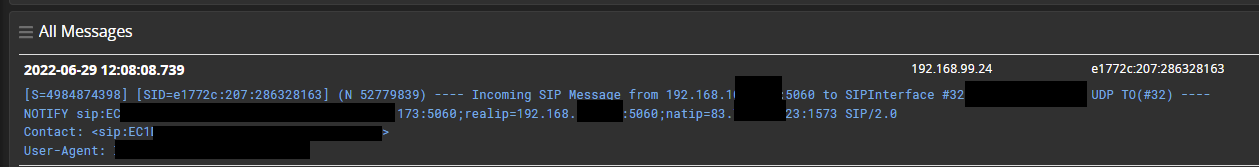
I totally agree with you, that parsing the data and store the relevant information is critial for the logs to be useful. But the system sending logs is quite atypical, this is an Audiocodes SBC. And it’s not only standard syslog messages that are being sent, it’s the full SIP data payload, routing rules matchs, headers transformations, etc. We need the full details for deep analysis and troubleshooting.
But the Show summary checkbox is still missing…
Anyway, I’ll be unavailable from now up to the 28th of July, it’s time for a trip
I expect this thread to be automatically closed after 14 days without any activity, but I’ll re-open a new thread to follow up !
I agree it might be a lot of work to write Grok patterns to parse all the different messages - but it’s woth it! I did so with a Cisco ASA, and now we have a chance to understand what is going on.