After Upgrade from 6.0.7 to 6.1 performance degrade?

1. Describe your incident:
Last week I upgraded from 5.2.x to 6.0.7 and everything worked fine as before. Now Graylog wanted an update again and I performed upgrade to 6.1.

Then Problems arise. Before I had an output of way over 15000 logs/s, but now I get only around 5-8000 logs/s, which is way to low and my journals piling up.
I changed nothing else, same configfile as before.

2. Describe your environment:

  • OS Information:
    Rocky Linux release 9.4 (Blue Onyx)

I’m working with a cluster of 4 graylog nodes and 4 opensearch nodes.

  • Package Version:
    graylog server open 6.1
  • Service logs, configurations, and environment variables:

some previously configured values of server.conf (were working!):
processbuffer_processors = 14
outputbuffer_processors = 10
output_batch_size = 3000

3. What steps have you already taken to try and solve the problem?
Changed some values in config file (see above) as they are said to got new defaults during upgrade, but with no change.
Neither removing the entries, nor changing to different values (like batch size to 30 mb) worked.

4. How can the community help?
Anyone has the same effekt after upgrade to 6.1?
Any ideas where to look for a reason?
Maybe something has changed in general and now less ressources are available?

General question: Where can I see, how many *buffer_processors are running?

Thanks a lot for every hint!

1 Like

A small update:

After downgrade to 6.0.7 the performance seems to be like before, again.
So it looks like there is indeed some difference between 6.0.x and 6.1 which affects the performance of sending the data to opensearch or the processing of the logs - I’m not sure yet, where the bottleneck actually is - only datapoint I see is the number of logoutput/sec.

2 Likes

Hi NicoS, thanks for reporting this!

May I ask if you have CPU utilization metrics for the graylog nodes for comparison of before/after the 6.1 upgrade? We’d be interested to know whether you observed CPU utilization on your Graylog nodes increased, reduced or was unchanged?

Changed some values in config file (see above) as they are said to got new defaults during upgrade

Do I understand correctly here, that the server.conf configuration was changed or over-written during the install? (Longshot, but would it be possible to provide a sanitized before/after of this file if it was changed?)

May I ask what the underlying spec of the Graylog nodes looks like in this case?

In the meantime, we’ll perform some comparative testing of 6.0.x and 6.1 to see if we can reproduce.

Hello,
After upgrading from 6.0.7 to 6.1.1 the search is very very very long also for me.
I use a VM single node and I changed nothing but the graylog update.
How can I downgrade to 6.0.7 ?

Hi Tully,

thanks for your reply! I’ll try to provide your requested details:

  1. here are my CPU graphs of my Opensearch Nodes and the Graylog Nodes for the week before the upgrade, until/including the day the upgrade was performed. However, as I downgraded soon after realizing the issue, there is no significant change visible. The slightly increase might be a result of the workers try to reduce the filled Journal, too.


    So from my point of view there was no significant change on CPU utilization.

  2. No, the upgrade itself did NOT change the config files. They stayed the same before and after the upgrade.
    However, I saw in the release notes, that there was a change in handling the option “output_batch_size” and the default values for “processbuffer/outpubuffer_processors” are now calculated automatically. So I fugured, that may be related to my issue and tried to remove my own settings or change to other values. But none of the change had an effect on the issue.

  3. here are my specs, 8 virtual systems on a ESX Server:
    3x Graylog with 8 cores 2.2 GHz 24 GB RAM
    1x Graylog with 12 cores 2.2 GHz 24 GB RAM (more Cores for testing purpose)
    4x Opensearch 8 cores 2.2GHz 32 GB RAM

Thanks a lot!

Br
Nico

If you have explicitly configured values in your server.conf these will override any automatic or predefined values:

processbuffer_processors = 14
outputbuffer_processors = 10
output_batch_size = 3000

Should still be applying. Are you exporting metrics using the Graylog Prometheus exporter? I ask because i’m curious what your buffers look like, specifically process and output buffers for your graylog nodes. If you are not exporting these i do recommend to read through Getting-Started-with-Metrics/readme.md at main · drewmiranda-gl/Getting-Started-with-Metrics · GitHub that covers both configuring exporters (you can ignore the parts you are already familiar with such as node_exporrter) as well as links to grafana dashboards you can use out of the box.

Is it safe to assume that the change in behavior on the chart is when you upgraded from 6.0 to 6.1? (Oct 21) It does look like your cpus were running somewhat close to capacity though averaging about 75% which i think is ok.

Are you using elasticsearch as your indexer (what version?)?

Anecdotally, albeit in a smaller environment, i’m not observing any performance differences between 6.0 and 6.1, both on message ingestion and search. I’m not saying there are not any impacting changes, but that there may be variables unique to your cluster.

@NicoS

Thanks for the metrics but as you say, not much visibility here.

Any possibility you could upload a sanitized copy of your server.conf so we can seek to replicate?

Thanks Drew,
Thanks Tully,

Drew, thanks for your clarification about the config values. So it looks like the *buffer_processors values are not the culprits (I already suspected that, as changing them did not change anything in the behaviour).

We use Opensearch 2.6.0 as indexer.
(Don’t be confused: in the beginning we used Elasticsearch - the hostnames are still the same after changing to Opensearch)

This is our server.conf (without comments and anonymised). All 4 nodes are pretty identical (only node 4 has some more processbuffers, as it has more cores). Everything else is left on defaults.

is_leader = true
node_id_file = /etc/graylog/server/node-id
password_secret = *******************
root_password_sha2 = *******************
bin_dir = /usr/share/graylog-server/bin
data_dir = /var/lib/graylog-server
plugin_dir = /usr/share/graylog-server/plugin
http_bind_address: 192.168.1.1:9000
http_external_uri = http://graylog.mydomain.com
stream_aware_field_types=false
elasticsearch_hosts = http://192.168.1.10:9200,http://192.168.1.11:9200,http://192.168.1.12:9200,http://192.168.1.13:9200
elasticsearch_connect_timeout = 5s
elasticsearch_idle_timeout = 60s
elasticsearch_max_total_connections = 512
elasticsearch_max_total_connections_per_route = 128
rotation_strategy = size
elasticsearch_max_docs_per_index = 20000000
elasticsearch_max_number_of_indices = 20
retention_strategy = delete
elasticsearch_shards = 4
elasticsearch_replicas = 0
elasticsearch_index_prefix = graylog
allow_leading_wildcard_searches = false
allow_highlighting = false
elasticsearch_analyzer = standard
output_batch_size = 3000
output_flush_interval = 1
output_fault_count_threshold = 5
output_fault_penalty_seconds = 30
processbuffer_processors = 12
outputbuffer_processors = 8
processor_wait_strategy = blocking
ring_size = 65536
inputbuffer_ring_size = 65536
inputbuffer_processors = 2
inputbuffer_wait_strategy = blocking
message_journal_enabled = true
message_journal_dir = /var/lib/graylog-server/journal
message_journal_max_size = 10gb
lb_recognition_period_seconds = 3
mongodb_uri = mongodb://graylog01.mydomain.com:27017,graylog02.mydomain.com:27017,graylog04.mydomain.com:27017,graylog03.mydomain.com:27017/graylog?replicaSet=rs0
mongodb_max_connections = 1000
http_proxy_uri = http://proxy.mydomain:3128
http_non_proxy_hosts = localhost,127.0.0.1,192.168.1.*,*.mydomain.com
prometheus_exporter_enabled = true
prometheus_exporter_bind_address = 192.168.1.1:9833

Our output buffer values the last two weeks:

And the process buffers:

Unfortunately the timespan is very short, where we had the issues, as I immediately downgraded to fix it… So again there is not much visible…
Let me know, if you want a more “zoomed in” graph.

Drew, you are right, our machines are pretty high on load - I tried to utilize them as much as possible. However, the weeks before the update we had no problems, all logs could be written in time (no journal filling).

Hi NicoS

Looking at your configuration - I have a suspicion that you might have your buffer values too high Graylog side. Having too many threads can actually reduce throughput - with 8 cores, 22 threads between input/processor/output strikes me as high enough to cause Graylog to near-100% CPU usage when it receives enough traffic in a short period or has a full Journal to clear, which can result in a lot of cycles lost to contention and waits - you may actually benefit from stepping these down - perhaps try out a total closer to 16 threads.

A concept well illustrated by this grainy photograph of an e-book:

I’d suggest it might be worth using a larger Journal size if you can (not related to this issue, but it’s good practice to have 1+ day of typical ingest in sum journal size between your nodes, if you have the storage).

There is not much we can deduce from these metric screenshots unfortunately, except that it looks like the constraint is first visible at the point of outputting to OS.

May I ask some questions re: the Opensearch side?

I see the OS nodes are 32GB Ram - is ~16GB of Heap memory assigned?
May I ask what indexing strategy you use, with what configuration for shard count/replicas?
May I ask the total shard count on your OS cluster at present (visible on System/Overview)?

And just to note that we’ve got some internal performance tests running on 6.0.x vs 6.1.x at the moment, will report back here when complete.

Best
Tully

To come back here, we were unable to replicate a performance difference between 6.0.x and 6.1.x in lab conditions performing the same stress test.

Seen here, 6.0.x on the left, 6.1.x on the right.

Its speculation but upon starting 6.1.x you may have just been observing the effect of a filled journal getting emptied plus delayed OS maintenance actions like Index Optimization & Rotation kicking in when the app the started up causing a temporary drop in OS performance.

tellistone,

  • Thanks for your suggestions regarding threads!
    A while ago I did some experiments with different values and the recent settings are the outcome, wich showed the best output rate (which was my only measurement) during my tests.
    If I find some time, I will reduce them again, to see if something changes.
    However, for some weeks before the upgrade attempt everything was fine and Journal was not used…

  • Journal
    After your suggestion to extend the Journal size, I’m thinking of changing it, indeed. However, my concern is, if I have bigger Journals, it will take much longer for the system to finish them. But it’s worth a try…

  • Regarding the opensearch questions:
    yes, we have about half of memory assigned for heap.
    We use rotation strategy by size, retention strategy: delete, max index size of 15,4 GB and 280 indices max (wich result in about 75 % disk usage)
    4 shards, 1 replica
    Shards: 2303 active, 0 initializing, 0 relocating, 0 unassigned

  • Last week I did another attempt to upgrade, this time I focused on one node only. Same result, output rate dropped significant. Even more interesting: it looked like the other nodes (which were left untouched) reduced the outputrate, too. Unfortunately I missed getting screenshots.
    But I’ll try it once more the next days. Maybe with changed settings from above…

Hi NicoS

You mentioned that your OS cluster spec is:

4x 32 GB RAM (64GB heap total).

64gb Heap is an OS spec optimal for running up to 1280 shards [Cluster total heap * 20]- if you are running 2303 shards, you would significantly benefit from some optimization in this area.

Some thoughts:

  • If you are using Index Optimization on your index sets, which compresses indicies after rotation, you could reasonably increase your max index size to [shards * 20]. If you have index sets configured to 4 shards, that would be 80gb index size. The goal is to achieve a shard size of around [0.6 * OS node ram], which for your setup is around 20GB.

  • Using a shard count on an index set higher than 1 is only suggested if you are either write constrained, or writing most of your data into a single index set. Increasing the shard count only improves write speed (by distributing the work over multiple OS nodes), it doesn’t benefit read speed at all and has a significant cost in resource usage. If you are spreading your data over a reasonable number of index sets (4+), you would benefit from dropping that shard count on your index sets to 1 (and to go with that, a max index size of 20mb).

Hi Tully,

thanks again for your thoughts. I will try that optimizations later on (as more performance is always better :slight_smile: ). Would be great, if this could be mentioned somewhere in the docs, too - I could not find anything similar and as detailed anywhere beforehand :slight_smile:

However, what I still don’t understand: I don’t have performance issues with 6.0.7, but only on 6.1.1. While I agree, that our machines might already are working near their limit :slight_smile:

In fact I did a new upgrade attempt today and gathered some interesting screenshots this time.

As you can see, I started around 12:00 with changing my Journal sizes from 10 to 20 Gb and restarted all 4 Graylogs. This caused the few output drops you see until around 12:15. (So no problem here.)

Then I upgraded my node 4 (“GL04”) at around 12:20. Immediately the journals started to fill, as my outputrate dropped especially for the node 04. And even more strange, the other nodes started to fill their journals as well (but not as quick as GL 04).

Everything else but node 04 was completely left untouched by me. Neither any Opensearch node nor the other Graylog nodes were changed in any way. But there is also some chatter in the output graph of ALL nodes, which I do not understand… It looks like the upgrade did affect all nodes in some way.

I left the new version running for about 2 hours to overcome any temporary drops, but without any positive effect. Output rate is under 40000 Logs/s and GL 04 dropped to around 8500 Logs/s while the others are on around 9500 Logs/s per node. (Just for comparison: Before and after the upgrade all nodes managed at least 10500 Logs/s - right as much as the input rate)

Immediately after downgrade to 6.0.8 (this time, instead of 6.0.7, as there was a newer version available), everything started to get normal again, all the Journals were quickly processed in expected speed (~51000 Logs/s total)

After around 15:30 all my performance values are exactly like before the upgrade…

So I still suspect, there might be something in Version 6.1.1 which “steals” performance comparing to 6.0.7/8.

Hi NicoS

Thanks for the detail, that is much more descriptive. It looks like a bottleneck develops in processing speed, which rules out an issue Output/OS side. To replicate this, we’d need an export of your pipelines & pipeline rules (perhaps message these privately).

To narrow down where the processing cycles are primarily being spent, you might create the following aggregation within Graylog:

gl2_processing_duration indicates how much time was spent processing the message.

Hi,

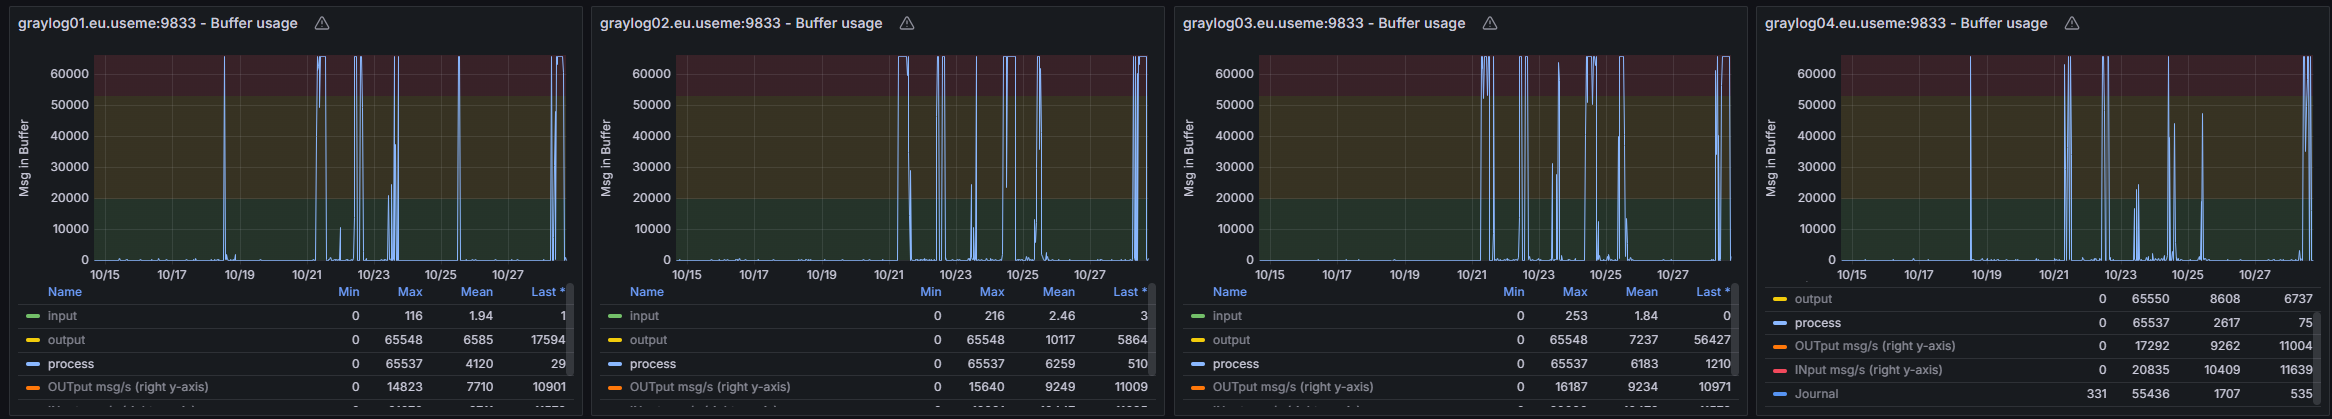
at first the requested processing time graph.
I could not get it to display minutes (like in your version), but should give the overview.

Our Pipelines look like this:

The pipeline rules are exported to this content pack. Please note, I sanitized some of the contained IP addresses manually. The rest is mostly from other common available sources and content packs, anyway.

{
  "v": 1,
  "id": "36c526ed-7b6c-47b4-9a0a-61076686e85e",
  "rev": 1,
  "name": "Export of Pipelines",
  "summary": "Export Pipelines for troubleshooting",
  "description": "",
  "vendor": "NicoS",
  "url": "",
  "parameters": [],
  "entities": [
    {
      "v": "1",
      "type": {
        "name": "pipeline_rule",
        "version": "1"
      },
      "id": "0364134b-ae00-4b2d-9586-3918a6628f84",
      "data": {
        "title": {
          "@type": "string",
          "@value": "FW__find_FWID_from_IP_in_REMOTE-IP"
        },
        "description": {
          "@type": "string",
          "@value": ""
        },
        "source": {
          "@type": "string",
          "@value": "rule \"FW__find_FWID_from_IP_in_REMOTE-IP\"\nwhen\n  not has_field(\"FW_ID\",$message)\nthen\n  let SOURCE = to_string($message.gl2_remote_ip);\n  let FW_ID = lookup_value(\"NameOrIP_to_FWID\", SOURCE);\n  set_field(\"FW_ID\", FW_ID);\n  //set_field(\"DEBUG_0724\", \"from remoteIP\");\nend"
        }
      },
      "constraints": [
        {
          "type": "server-version",
          "version": ">=6.0.7+4779d72"
        }
      ]
    },
    {
      "v": "1",
      "type": {
        "name": "pipeline_rule",
        "version": "1"
      },
      "id": "a7542b6c-1390-42d6-a19a-d1c129f8a4c0",
      "data": {
        "title": {
          "@type": "string",
          "@value": "SRX IDS Fields SRC-DST-PORT"
        },
        "description": {
          "@type": "string",
          "@value": ""
        },
        "source": {
          "@type": "string",
          "@value": "rule \"SRX IDS Fields SRC-DST-PORT\"\nwhen \n    contains(to_string($message.message),\"RT_IDS\")\nthen\n    let matches = grok(pattern: \"source: %{IPV4:src_ip}\", value: to_string($message.message));\n    set_fields(matches);\n    \n    let matches = grok(pattern: \"destination: %{IPV4:dst_ip}\", value: to_string($message.message));\n    set_fields(matches);\n        \n    set_field(\"FW_SRX_lsys\", \"root\");\n    let matches = grok(pattern: \"Lsys: %{USERNAME:FW_SRX_lsys}\", value: to_string($message.message), only_named_captures: true);\n    set_fields(matches);\n    \nend"
        }
      },
      "constraints": [
        {
          "type": "server-version",
          "version": ">=6.0.7+4779d72"
        }
      ]
    },
    {
      "v": "1",
      "type": {
        "name": "pipeline_rule",
        "version": "1"
      },
      "id": "ff7225e9-9149-4011-89b7-fac61b30dac9",
      "data": {
        "title": {
          "@type": "string",
          "@value": "FW__Exclude_Scanners"
        },
        "description": {
          "@type": "string",
          "@value": "Exclude logs generated by Security Scanners"
        },
        "source": {
          "@type": "string",
          "@value": "rule \"FW__Exclude_Scanners\"\nwhen\n  cidr_match(\"127.0.0.160/29\", to_ip($message.src_ip)) || \n  cidr_match(\"127.0.0.128/28\", to_ip($message.src_ip)) || \n  cidr_match(\"127.0.0.46/32\", to_ip($message.src_ip)) || \n  cidr_match(\"127.0.0.47/32\", to_ip($message.src_ip)) || \n  cidr_match(\"127.0.0.89/32\", to_ip($message.src_ip)) || \n  cidr_match(\"127.0.0.105/32\", to_ip($message.src_ip)) || \n  cidr_match(\"127.0.0.107/32\", to_ip($message.src_ip)) || \n  cidr_match(\"127.0.0.108/32\", to_ip($message.src_ip)) || \n  cidr_match(\"127.0.0.212/32\", to_ip($message.src_ip)) || \n  cidr_match(\"127.0.0.213/32\", to_ip($message.src_ip)) || \n  cidr_match(\"127.0.0.224/28\", to_ip($message.src_ip)) || \n  cidr_match(\"127.0.0.0/24\", to_ip($message.src_ip)) || \n  cidr_match(\"127.0.0.160/27\", to_ip($message.src_ip)) || \n  cidr_match(\"127.0.0.14/32\", to_ip($message.src_ip)) || \n  cidr_match(\"127.0.0.54/32\", to_ip($message.src_ip)) || \n  cidr_match(\"127.0.0.240/28\", to_ip($message.src_ip)) ||\n  cidr_match(\"127.0.0.128/27\", to_ip($message.src_ip)) || \n  cidr_match(\"127.0.0.192/27\", to_ip($message.src_ip)) || \n  cidr_match(\"127.0.0.32/28\", to_ip($message.src_ip)) || \n  cidr_match(\"127.0.0.208/28\", to_ip($message.src_ip)) || \n  cidr_match(\"127.0.0.176/29\", to_ip($message.src_ip)) || \n  cidr_match(\"127.0.0.96/32\", to_ip($message.src_ip)) || \n  cidr_match(\"127.0.0.97/32\", to_ip($message.src_ip)) || \n  cidr_match(\"127.0.0.98/32\", to_ip($message.src_ip)) || \n  cidr_match(\"127.0.0.105/32\", to_ip($message.src_ip)) || \n  cidr_match(\"127.0.0.16/28\", to_ip($message.src_ip)) || \n  cidr_match(\"127.0.0.160/29\", to_ip($message.src_ip))\nthen\n //set_field(\"DEBUG\", to_string(\"SCANNER \" + to_string($message.src_ip)));\n drop_message();\n  \nend"
        }
      },
      "constraints": [
        {
          "type": "server-version",
          "version": ">=6.0.7+4779d72"
        }
      ]
    },
    {
      "v": "1",
      "type": {
        "name": "pipeline_rule",
        "version": "1"
      },
      "id": "0f9a483a-1072-42d0-a75f-0e4bd6b93397",
      "data": {
        "title": {
          "@type": "string",
          "@value": "ASA syslog/UDP raw header"
        },
        "description": {
          "@type": "string",
          "@value": "Cisco ASA Log header\n"
        },
        "source": {
          "@type": "string",
          "@value": "rule \"ASA syslog/UDP raw header\"\nwhen\n    has_field(\"message\")\nthen\n    let raw_log = to_string($message.message);\n    let header = grok(pattern:\"%{CISCOTAG:ciscotag}: %{GREEDYDATA:cisco_message}\", value: raw_log,only_named_captures: true);\n    set_fields(header);\nend\n"
        }
      },
      "constraints": [
        {
          "type": "server-version",
          "version": ">=6.0.7+4779d72"
        }
      ]
    },
    {
      "v": "1",
      "type": {
        "name": "pipeline",
        "version": "1"
      },
      "id": "38ee5c57-bb63-4646-a97c-8ec70d4d1633",
      "data": {
        "title": {
          "@type": "string",
          "@value": "Cisco ASA FieldsParser"
        },
        "description": {
          "@type": "string",
          "@value": "Pipeline for the Cisco ASA"
        },
        "source": {
          "@type": "string",
          "@value": "pipeline \"Cisco ASA FieldsParser\"\nstage 0 match either\nrule \"ASA syslog/UDP raw header\"\nstage 1 match either\nrule \"ASA syslog/UDP raw log\"\nstage 2 match either\nrule \"ASA authentication src_ip geoip lookup\"\nrule \"Threat Intelligence Lookups: src_ip\"\nend"
        },
        "connected_streams": [
          {
            "@type": "string",
            "@value": "67c14ae6-7187-482a-b76e-40e2259fba58"
          }
        ]
      },
      "constraints": [
        {
          "type": "server-version",
          "version": ">=6.0.7+4779d72"
        }
      ]
    },
    {
      "v": "1",
      "type": {
        "name": "pipeline",
        "version": "1"
      },
      "id": "e1614980-5d0b-4dba-a7f0-16b3ec9b6fe8",
      "data": {
        "title": {
          "@type": "string",
          "@value": "FW Fieldparser SRX"
        },
        "description": {
          "@type": "string",
          "@value": ""
        },
        "source": {
          "@type": "string",
          "@value": "pipeline \"FW Fieldparser SRX\"\nstage 0 match either\nrule \"Is SRX FW\"\nstage 1 match either\nrule \"SRX IDS Fields SRC-DST-PORT\"\nrule \"SRX FW Fields SRC-DST-PORT\"\nend"
        },
        "connected_streams": [
          {
            "@type": "string",
            "@value": "67c14ae6-7187-482a-b76e-40e2259fba58"
          }
        ]
      },
      "constraints": [
        {
          "type": "server-version",
          "version": ">=6.0.7+4779d72"
        }
      ]
    },
    {
      "v": "1",
      "type": {
        "name": "pipeline_rule",
        "version": "1"
      },
      "id": "ca7f92ad-0888-49e7-a4b9-50ed3826098e",
      "data": {
        "title": {
          "@type": "string",
          "@value": "Netscreen fields parser"
        },
        "description": {
          "@type": "string",
          "@value": "parses firewall relevant fields from netscreen logs"
        },
        "source": {
          "@type": "string",
          "@value": "rule \"Netscreen fields parser\"\nwhen\n  contains(to_string($message.message),\"netscreen\",true)\nthen\n  let fields = grok(pattern: \"(src=%{IPV4:src_ip}|dst=%{IPV4:dst_ip})\", value: to_string($message.message));\n  let raw_msg = to_string($message.message);\n\n  set_fields(grok(pattern: \"src=%{IPV4:src_ip}\", value: raw_msg ));  \n  set_fields(grok(pattern: \"dst=%{IPV4:dst_ip}\", value: raw_msg ));\n  set_fields(grok(pattern: \"src_port=%{INT:src_port}\", value: raw_msg ));\n  set_fields(grok(pattern: \"dst_port=%{INT:dst_port}\", value: raw_msg ));\n  set_fields(grok(pattern: \"action=%{WORD:action}\", value: raw_msg ));\n\n  set_fields(fields);\n  set_field(\"FW_Logtype\", \"netscreen\");\nend"
        }
      },
      "constraints": [
        {
          "type": "server-version",
          "version": ">=6.0.7+4779d72"
        }
      ]
    },
    {
      "v": "1",
      "type": {
        "name": "pipeline",
        "version": "1"
      },
      "id": "8798b2c0-fff6-4db7-96d6-11bac980433f",
      "data": {
        "title": {
          "@type": "string",
          "@value": "FW Fieldparser Netscreen"
        },
        "description": {
          "@type": "string",
          "@value": ""
        },
        "source": {
          "@type": "string",
          "@value": "pipeline \"FW Fieldparser Netscreen\"\nstage 0 match either\nrule \"Netscreen fields parser\"\nend"
        },
        "connected_streams": [
          {
            "@type": "string",
            "@value": "67c14ae6-7187-482a-b76e-40e2259fba58"
          }
        ]
      },
      "constraints": [
        {
          "type": "server-version",
          "version": ">=6.0.7+4779d72"
        }
      ]
    },
    {
      "v": "1",
      "type": {
        "name": "pipeline_rule",
        "version": "1"
      },
      "id": "f658a039-76ce-4e17-aeff-3ac5bf24b732",
      "data": {
        "title": {
          "@type": "string",
          "@value": "ASA authentication src_ip geoip lookup"
        },
        "description": {
          "@type": "string",
          "@value": "Authentication Attempt to the firewall"
        },
        "source": {
          "@type": "string",
          "@value": "rule \"ASA authentication src_ip geoip lookup\"\nwhen\n has_field(\"src_ip\") AND (regex(\"ASA-6-113005|ASA-6-113015\", to_string($message.ciscotag)).matches == true)\nthen\n let geo = lookup(\"geoip-lookup\", to_string($message.src_ip));\n  set_field(\"src_ip_geolocation\", geo[\"coordinates\"]);\n  set_field(\"src_ip_geo_country_code\", geo[\"country\"].iso_code);\n  set_field(\"src_ip_geo_country_name\", geo[\"country\"].names.en);\n  set_field(\"src_ip_geo_city_name\", geo[\"city\"].names.en); \n  set_field(\"FW_Logtype\", \"ASA\");\nend"
        }
      },
      "constraints": [
        {
          "type": "server-version",
          "version": ">=6.0.7+4779d72"
        }
      ]
    },
    {
      "v": "1",
      "type": {
        "name": "pipeline_rule",
        "version": "1"
      },
      "id": "8dd77d9f-caa0-4b64-acef-1c26954a27cd",
      "data": {
        "title": {
          "@type": "string",
          "@value": "Is SRX FW"
        },
        "description": {
          "@type": "string",
          "@value": ""
        },
        "source": {
          "@type": "string",
          "@value": "rule \"Is SRX FW\"\nwhen \n    has_field(\"message\") \n    && ( \n      contains(to_string($message.message),\"RT_FLOW_SESSION\") || \n      contains(to_string($message.message),\"RT_IDS\") )\nthen\n    set_field(\"FW_Logtype\", \"SRX\");\nend"
        }
      },
      "constraints": [
        {
          "type": "server-version",
          "version": ">=6.0.7+4779d72"
        }
      ]
    },
    {
      "v": "1",
      "type": {
        "name": "pipeline_rule",
        "version": "1"
      },
      "id": "24b517ff-e068-4e60-9e4c-5d625b7a1165",
      "data": {
        "title": {
          "@type": "string",
          "@value": "Threat Intelligence Lookups: src_ip"
        },
        "description": {
          "@type": "string",
          "@value": "Threat Intelligence Lookups. By src_ip"
        },
        "source": {
          "@type": "string",
          "@value": "rule \"Threat Intelligence Lookups: src_ip\"\nwhen\n has_field(\"src_ip\") AND (regex(\"ASA-6-113005|ASA-6-113015\", to_string($message.ciscotag)).matches == true)\nthen\n set_fields(threat_intel_lookup_ip(to_string($message.src_ip), \"src_ip\"));\nEnd"
        }
      },
      "constraints": [
        {
          "type": "server-version",
          "version": ">=6.0.7+4779d72"
        }
      ]
    },
    {
      "v": "1",
      "type": {
        "name": "pipeline_rule",
        "version": "1"
      },
      "id": "cf5cba87-0d1e-49b1-b428-dd4a19c66027",
      "data": {
        "title": {
          "@type": "string",
          "@value": "SRX FW Fields SRC-DST-PORT"
        },
        "description": {
          "@type": "string",
          "@value": "Extracts SRX firewall specific fields"
        },
        "source": {
          "@type": "string",
          "@value": "rule \"SRX FW Fields SRC-DST-PORT\"\nwhen \n    contains(to_string($message.message),\"RT_FLOW_SESSION\")\nthen\n    let matches = grok(pattern: \"%{IPV4:src_ip}/%{INT:src_port}->%{IPV4:dst_ip}/%{INT:dst_port}\", value: to_string($message.message));\n    set_fields(matches);\n    \n    set_field(\"FW_SRX_lsys\", \"root\");\n    let matches = grok(pattern: \"Lsys %{USERNAME:FW_SRX_lsys}\", value: to_string($message.message), only_named_captures: true);\n    set_fields(matches);\n    \n\n    set_field(\"FW_Logtype\", \"SRX\");\n    //route_to_stream(name: \"Nicos_Teststream\");\nend"
        }
      },
      "constraints": [
        {
          "type": "server-version",
          "version": ">=6.0.7+4779d72"
        }
      ]
    },
    {
      "v": "1",
      "type": {
        "name": "pipeline_rule",
        "version": "1"
      },
      "id": "63f375ef-6a79-463c-9b63-3115cfba1a67",
      "data": {
        "title": {
          "@type": "string",
          "@value": "FW__find_FWID_from_Name_or_IP_in_SOURCE"
        },
        "description": {
          "@type": "string",
          "@value": ""
        },
        "source": {
          "@type": "string",
          "@value": "rule \"FW__find_FWID_from_Name_or_IP_in_SOURCE\"\nwhen\n  not has_field(\"FW_ID\",$message)\nthen\n  let SOURCE = to_string($message.\"source\");\n  let FW_ID = lookup_value(\"NameOrIP_to_FWID\", SOURCE);\n  set_field(\"FW_ID\", FW_ID);\n  //set_field(\"DEBUG_0724\", \"from source\");\nend"
        }
      },
      "constraints": [
        {
          "type": "server-version",
          "version": ">=6.0.7+4779d72"
        }
      ]
    },
    {
      "v": "1",
      "type": {
        "name": "pipeline_rule",
        "version": "1"
      },
      "id": "f3d8e9b9-fe64-4938-a004-6666b9e349fe",
      "data": {
        "title": {
          "@type": "string",
          "@value": "ASA syslog/UDP raw log"
        },
        "description": {
          "@type": "string",
          "@value": "Cisco ASA Log rules. "
        },
        "source": {
          "@type": "string",
          "@value": "rule \"ASA syslog/UDP raw log\"\nwhen\n    has_field(\"cisco_message\")\nthen\n    let raw_log = to_string($message.cisco_message);\n//    let cisco_asa = grok(pattern:\"(%{CISCOFW104001}|%{CISCOFW104002}|%{CISCOFW104003}|%{CISCOFW104004}|%{CISCOFW105003}|%{CISCOFW105004}|%{CISCOFW105005}|%{CISCOFW105008}|%{CISCOFW106100_2_3}|%{CISCOFW106001}|%{CISCOFW106015}|%{CISCOFW106023}|%{CISCOFW113003}|%{CISCOFW113004}|%{CISCOFW113005}|%{CISCOFW113008}|%{CISCOFW113009_113011}|%{CISCOFW113014}|%{CISCOFW113015}|%{CISCOFW113019}|%{CISCOFW113022_3}|%{CISCOFW113039}|%{CISCOFW313005}|%{CISCOFW401004}|%{CISCOFW419001}|%{CISCOFW419002}|%{CISCOFW434002}|%{CISCOFW500004}|%{CISCOFW507003}|%{CISCOFW710001_710002_710003_710005_710006}|%{CISCOFW722037}|%{CISCOFW733100}|%{CISCOFW733100}|%{CISCOFW733102}|%{CISCOFW733103})\", value:raw_log,only_named_captures: true);\n    let cisco_asa = grok(pattern:\"(%{CISCOFW104001}|%{CISCOFW104002}|%{CISCOFW104003}|%{CISCOFW104004}|%{CISCOFW105003}|%{CISCOFW105004}|%{CISCOFW105005}|%{CISCOFW105008}|%{CISCOFW106100_2_3}|%{CISCOFW106001}|%{CISCOFW106015}|%{CISCOFW106023}|%{CISCOFW113003}|%{CISCOFW113004}|%{CISCOFW113005}|%{CISCOFW113008}|%{CISCOFW113009_113011}|%{CISCOFW113014}|%{CISCOFW113015}|%{CISCOFW113019}|%{CISCOFW113022_3}|%{CISCOFW113039}|%{CISCOFW302013_302014_302015_302016}|%{CISCOFW302020_302021}|%{CISCOFW313005}|%{CISCOFW401004}|%{CISCOFW419001}|%{CISCOFW419002}|%{CISCOFW434002}|%{CISCOFW500004}|%{CISCOFW507003}|%{CISCOFW710001_710002_710003_710005_710006}|%{CISCOFW722037}|%{CISCOFW733100}|%{CISCOFW733100}|%{CISCOFW733102}|%{CISCOFW733103}|%{CiscoASA106100})\", value:raw_log,only_named_captures: true);\n    set_fields(cisco_asa);\n    remove_field(\"cisco_message\");\n    set_field(\"FW_Logtype\", \"ASA\");\nend"
        }
      },
      "constraints": [
        {
          "type": "server-version",
          "version": ">=6.0.7+4779d72"
        }
      ]
    },
    {
      "v": "1",
      "type": {
        "name": "pipeline_rule",
        "version": "1"
      },
      "id": "521fa014-d544-406a-adb4-fd9373c6782e",
      "data": {
        "title": {
          "@type": "string",
          "@value": "FW__add_additional_common_information"
        },
        "description": {
          "@type": "string",
          "@value": ""
        },
        "source": {
          "@type": "string",
          "@value": "rule \"FW__add_additional_common_information\"\nwhen\n  true\nthen\n  set_field(\"FW_LogsourceIP\", to_string($message.gl2_remote_ip));\n  \n  //set_field(\"DEBUG_GLnode\", to_string($message.gl2_source_node));\n  \n  // set_field(\"XX_debug\",\"8\");\n  // set_field(\"DEBUG_msglen\", to_string(length(to_string($message.message))));\n\nend"
        }
      },
      "constraints": [
        {
          "type": "server-version",
          "version": ">=6.0.7+4779d72"
        }
      ]
    },
    {
      "v": "1",
      "type": {
        "name": "pipeline",
        "version": "1"
      },
      "id": "15714bce-4e2e-46f7-8c48-2b80ca0e2ec7",
      "data": {
        "title": {
          "@type": "string",
          "@value": "Scanner-Filter"
        },
        "description": {
          "@type": "string",
          "@value": "Filter out all logs generated from Siemens Scanner IPs"
        },
        "source": {
          "@type": "string",
          "@value": "pipeline \"Scanner-Filter\"\nstage 4 match pass\nrule \"FW__Exclude_Scanners\"\nend"
        },
        "connected_streams": [
          {
            "@type": "string",
            "@value": "67c14ae6-7187-482a-b76e-40e2259fba58"
          }
        ]
      },
      "constraints": [
        {
          "type": "server-version",
          "version": ">=6.0.7+4779d72"
        }
      ]
    },
    {
      "v": "1",
      "type": {
        "name": "pipeline_rule",
        "version": "1"
      },
      "id": "1952a36c-8421-44e3-ab62-b62558c32f62",
      "data": {
        "title": {
          "@type": "string",
          "@value": "FW__add_additional_information_by_FWID"
        },
        "description": {
          "@type": "string",
          "@value": ""
        },
        "source": {
          "@type": "string",
          "@value": "rule \"FW__add_additional_information_by_FWID\"\nwhen\n  has_field(\"FW_ID\", $message)\nthen\n  let ADMINGROUP = lookup_value(\"ADMINGROUP_from_FWID\", $message.FW_ID);\n  set_field(\"FW_Admingroup\", ADMINGROUP);\n  \n  let CLEARNAME = lookup_value(\"CLEARNAME_from_FWID\", $message.FW_ID);\n  set_field(\"FW_Clearname\", CLEARNAME);\n\n  let CUSTOMER = lookup_value(\"CUSTOMER_from_FWID\", $message.FW_ID);\n  set_field(\"FW_Customer\", CUSTOMER);\n\nend"
        }
      },
      "constraints": [
        {
          "type": "server-version",
          "version": ">=6.0.7+4779d72"
        }
      ]
    },
    {
      "v": "1",
      "type": {
        "name": "pipeline",
        "version": "1"
      },
      "id": "4a58acaa-af88-4bc8-815a-14f8d453c9de",
      "data": {
        "title": {
          "@type": "string",
          "@value": "FW_Enricher"
        },
        "description": {
          "@type": "string",
          "@value": ""
        },
        "source": {
          "@type": "string",
          "@value": "pipeline \"FW_Enricher\"\nstage 6 match pass\nrule \"FW__find_FWID_from_Name_or_IP_in_SOURCE\"\nstage 7 match pass\nrule \"FW__find_FWID_from_IP_in_REMOTE-IP\"\nstage 8 match pass\nrule \"FW__add_additional_information_by_FWID\"\nstage 9 match pass\nrule \"FW__add_additional_common_information\"\nend"
        },
        "connected_streams": [
          {
            "@type": "string",
            "@value": "67c14ae6-7187-482a-b76e-40e2259fba58"
          }
        ]
      },
      "constraints": [
        {
          "type": "server-version",
          "version": ">=6.0.7+4779d72"
        }
      ]
    },
    {
      "v": "1",
      "type": {
        "name": "stream_title",
        "version": "1"
      },
      "id": "67c14ae6-7187-482a-b76e-40e2259fba58",
      "data": {
        "title": {
          "@type": "string",
          "@value": "Default Stream"
        }
      },
      "constraints": [
        {
          "type": "server-version",
          "version": ">=6.0.7+4779d72"
        }
      ]
    }
  ]
}

This topic was automatically closed 14 days after the last reply. New replies are no longer allowed.

Hey @NicoS!

Do you have metrics for your OpenSearch-cluster by any chance? It would be interesting to see if there is more load on it when upgrading one node to 6.1.x.

Hi Dennis,

thanks for opening this topic again :slight_smile:

I’ll schedule another upgrade attempt soon and will gather some metrics for opensearch then.

Best regards
Nico

1 Like

Hi @NicoS,

when you you upgrade one node next time, could you please also check for suspicious lines in the Graylog server log, e.g. more indexing errors or retries being logged?