Greetings, all; I have what I feel is odd behavior.
I have two Fortigate Firewall’s shipping their logs in RFC5424 format to my Graylog server. “Raw” (i.e. input is set, but not picked off by any streams) the formatting is perfect; Graylog automatically pulls the keys and their corresponding values. However, as soon as I set up a stream (Note: Matches are removed from the default stream), the keys and values are lost and all I get it a handful of keys and the message.
No matter, I’ll create a pipeline rule. So I create a pretty standard pipeline rule and test it. It does exactly what I want (i.e. returning it to how the message was parsed prior to the stream grabbing hold of it). However, associating the Pipeline Rule to a Pipeline that is attached to the stream (its the only rule btw) causes the messages to disappear (i.e. open up the stream and there are no messages stamped subsequent to the time the pipeline is engaged).
Messages are processed in this order:
Message Filter Chain
Stream Rule Processor
Pipeline Processor
Moving Pipeline Processing up predictably caused disaster (luckily I changed it right back before it could f**k up all my data).
Has anyone encountered this before? Any suggestions?
Oh: Graylog 5.2.2
Thank you!
EDIT: Potentially unrelated but Graylog has gotten painfully slow, too. I run it with 3 Opensearch Nodes, each 16 cores and 32GB Ram, and three Servers, each with 8 cores and 18GB Ram (heap limited to 8GB). Indices are rotated every 90 days, max number of indices is 5, and are limited to 1 shard and 1 replica, each.
Greetings. I’m not sure i have enough info to help as what you describe does not match my experience with graylog.
Are you using the syslog input or the raw/plaintext input?
Are you using extractors?
Are you using stream rules?
Do you have any parsing at all configured?
Can you better quantify what “painfully slow” means? Is that the entire web interface and all web queries that occur within the graylog UI? Is it only search queries? What is your daily ingest traffic on the system/overview page?
Greetings. I’m not sure i have enough info to help as what you describe does not match my experience with graylog.
Are you using the syslog input or the raw/plaintext input?
Are you using extractors?
Are you using stream rules?
Do you have any parsing at all configured?
Greetings; I hope you had a good Holiday Season
Syslog Input UDP
Not on the inputs related to the Fortigate Devices
Yes. I have one stream that collects the Fortigate logs (and subsequently removes them from the default stream) based on the gl2_source_input identifier
I am parsing via Pipeline Rules; here is my rule:
rule "RFC5425"
when
  has_field(
    field : "message"
  )
then
    set_fields(
        fields:
            key_value(
                value: to_string($message.message),
                delimiters:" ",
                kv_delimiters:"=",
                trim_key_chars:"\"",
                trim_value_chars: "\"")
            );
end
Can you better quantify what “painfully slow” means? Is that the entire web interface and all web queries that occur within the graylog UI? Is it only search queries? What is your daily ingest traffic on the system/overview page?
With respect to the slowness, it is the entire web interface as well as all web queries that occur within the graylog UI. Ingested traffic is ~10 to 20GB per day (our workforce varies greatly in size depending on project status and we rely heavily on ephemeral VMs.)
Thank you this is very helpful! So your parsing of your fortigate syslog works until you route the messages to a different stream? Were you using a stream rule configured on the stream itself, OR a pipeline rule to route the messages to a different stream?
Your specs seem more than enough power to handle 10-20GB/day so that is interesting. Do you have access to (or the ability to spin up) a prometheus/grafana setup? Graylog can expose prom compatible metrics that make troubleshooting much easier.
Thank you this is very helpful! So your parsing of your fortigate syslog works until you route the messages to a different stream? Were you using a stream rule configured on the stream itself, OR a pipeline rule to route the messages to a different stream?
So perhaps I am using the wrong terms but this is how I understand it (and forgive me in advance if I make this more confusing)
On the Fortigate, Syslogs are configured to send logs to Graylog (UDP RFC5424 format) by way of a NGINX proxy (round robin to 1 of 3 graylog servers).
Inputs on the Graylog servers are configured UDP Syslog w/ keeping full_message elected.
If you click on the “Show received messages” the recent messages come in with fields and values as you would expect
If you set up Stream (call it “Fortigate”) to catch the inputs (via gl2_source_input number) the fields and values are no longer mapped.
If you create a Pipeline Rule and attach it to a Pipeline that is attached to the Stream Fortigate, suddenly there are no recently messages in either the Stream view or via “Show received messages.” Ironically, metrics for the Pipeline show that it is processing messages and that there are no errors.
Your specs seem more than enough power to handle 10-20GB/day so that is interesting. Do you have access to (or the ability to spin up) a prometheus/grafana setup? Graylog can expose prom compatible metrics that make troubleshooting much easier.
Not at hand but I am sure I could spin something up when I have more freetime haha
Not sure if I mentioned this, but my Graylog setup is entirely contained in a ProxMox environment (Intel 32 Cores 128 GBs). They are not the only containers/services on the ProxMox, but the system is usually pegged at 95% use (RAM) though CPU is no more than 5% at any given moment.
If you click on the “Show received messages” the recent messages come in with fields and values as you would expect
Are you able to provide a screenshot or copy/paste (it can be redacted)? The syslog spec doesn’t support fields beyond timestamp, level, hostname, message. I’m curious how other fields are being added. There has to be something parsing those fields weather its an extractor or a pipeline rule.
if you set up Stream (call it “Fortigate”) to catch the inputs (via gl2_source_input number) the fields and values are no longer mapped.
Can you provide screenshots or a step by step of how you are setting this up?
If you create a Pipeline Rule and attach it to a Pipeline that is attached to the Stream Fortigate, suddenly there are no recently messages in either the Stream view
Can you share the pipeline rule? Is it ANY rule? Are there any errors in the graylog server.log?
system is usually pegged at 95% use (RAM)
This could be a potential cause of slowness but without data to measure it it is difficult to say for certain. Elasticsearch and OpenSearch are very memory intensive. Also searching for “All Messages” can be a very intense query.
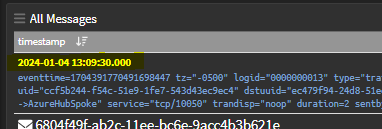
I applied the above pipeline at 1:09 PM EST and you can see the input is receiving messages (now at 01:15 PM EST):
But the last message is at 01:09:30:
It does appear that around the time the Pipeline was enabled, this error was repeated:
7 minutes ago ftg_3 9a923d52-ab2c-11ee-bc6e-9acc4b3b621e OpenSearchException[OpenSearch exception [type=mapper_parsing_exception, reason=failed to parse field [level] of type [long] in document with id '9a923d52-ab2c-11ee-bc6e-9acc4b3b621e'. Preview of field's value: 'notice']]; nested: OpenSearchException[OpenSearch exception [type=illegal_argument_exception, reason=For input string: "notice"]];
onlything showing up in the server log is:
WARN [LookupTableService] Lookup table <api_call> does not exist
which is odd because the pipeline rule in question does not use a lookup table and the other pipelines + rules seem to be functioning correctly
7 minutes ago ftg_3 9a923d52-ab2c-11ee-bc6e-9acc4b3b621e OpenSearchException[OpenSearch exception [type=mapper_parsing_exception, reason=failed to parse field [level] of type [long] in document with id ‘9a923d52-ab2c-11ee-bc6e-9acc4b3b621e’. Preview of field’s value: ‘notice’]]; nested: OpenSearchException[OpenSearch exception [type=illegal_argument_exception, reason=For input string: “notice”]];
OpenSearch (and Elasticsearch) use dynamic type mappings to for field types. The very first message in each index dictactes what type those particular fields will use. It appears that an earlier message was using numbers (long) in that field but parsing the fortigate messages, the level is a string so opensearch fails save the message because it cannot save a string value in a field that is typed as long.
You can add additional action to your pipeline rule to rename the field in the pipeline rule. Something like:
I am still very curious where the message was being parsed before. Having the message routed to a different stream makes me think there is/was a pipeline rule.
As to the mystery the only thing I can think of is that Fortigate logs are notoriously problematic. When configuring via the cli (which you must do if you want to configure the logs with any type of specificity) you can select “default” “csv” “RFC5424” and one other I can’t recall at this time. “Default” is traditional syslog format but really messes up timestamps so I chose RFC5424. It is possible the answer is in there, somewhere?