I’ve noticed that my Graylog master node (latest 2.3.1, latest ES5) seems to temporarily halt processing and backlog into the journal during a system operation. Accordingly, when that finishes, there is a huge spike in CPU trying to process out the messages in the journal. The other nodes continue processing messages during this interval.
2017-10-18T19:01:07.722-05:00 INFO  [SystemJobManager] SystemJob <76398270-b460-11e7-927e-0050568a5665> [org.graylog2.indexer.indices.jobs.SetIndexReadOnlyAndCalculateRangeJob] finished in 32579ms.
2017-10-18T20:00:35.572-05:00 ERROR [SystemJobManager] Unhandled error while running SystemJob <8845def0-b460-11e7-927e-0050568a5665> [org.graylog2.indexer.indices.jobs.OptimizeIndexJob]
org.graylog2.indexer.ElasticsearchException: Couldn't force merge index infoblox-named_40
        at org.graylog2.indexer.cluster.jest.JestUtils.execute(JestUtils.java:52) ~[graylog.jar:?]
        at org.graylog2.indexer.indices.Indices.optimizeIndex(Indices.java:629) ~[graylog.jar:?]
        at org.graylog2.indexer.indices.jobs.OptimizeIndexJob.execute(OptimizeIndexJob.java:71) ~[graylog.jar:?]
        at org.graylog2.system.jobs.SystemJobManager$1.run(SystemJobManager.java:89) [graylog.jar:?]
        at com.codahale.metrics.InstrumentedScheduledExecutorService$InstrumentedRunnable.run(InstrumentedScheduledExecutorService.java:235) [graylog.jar:?]
        at java.util.concurrent.Executors$RunnableAdapter.call(Executors.java:511) [?:1.8.0_131]
        at java.util.concurrent.FutureTask.run(FutureTask.java:266) [?:1.8.0_131]
        at java.util.concurrent.ScheduledThreadPoolExecutor$ScheduledFutureTask.access$201(ScheduledThreadPoolExecutor.java:180) [?:1.8.0_131]
        at java.util.concurrent.ScheduledThreadPoolExecutor$ScheduledFutureTask.run(ScheduledThreadPoolExecutor.java:293) [?:1.8.0_131]
        at java.util.concurrent.ThreadPoolExecutor.runWorker(ThreadPoolExecutor.java:1142) [?:1.8.0_131]
        at java.util.concurrent.ThreadPoolExecutor$Worker.run(ThreadPoolExecutor.java:617) [?:1.8.0_131]
        at java.lang.Thread.run(Thread.java:748) [?:1.8.0_131]
Caused by: java.net.SocketTimeoutException: Read timed out
        at java.net.SocketInputStream.socketRead0(Native Method) ~[?:1.8.0_131]
        at java.net.SocketInputStream.socketRead(SocketInputStream.java:116) ~[?:1.8.0_131]
        at java.net.SocketInputStream.read(SocketInputStream.java:171) ~[?:1.8.0_131]
        at java.net.SocketInputStream.read(SocketInputStream.java:141) ~[?:1.8.0_131]
        at org.apache.http.impl.io.SessionInputBufferImpl.streamRead(SessionInputBufferImpl.java:137) ~[graylog.jar:?]
        at org.apache.http.impl.io.SessionInputBufferImpl.fillBuffer(SessionInputBufferImpl.java:153) ~[graylog.jar:?]
        at org.apache.http.impl.io.SessionInputBufferImpl.readLine(SessionInputBufferImpl.java:282) ~[graylog.jar:?]
        at org.apache.http.impl.conn.DefaultHttpResponseParser.parseHead(DefaultHttpResponseParser.java:138) ~[graylog.jar:?]
        at org.apache.http.impl.conn.DefaultHttpResponseParser.parseHead(DefaultHttpResponseParser.java:56) ~[graylog.jar:?]
        at org.apache.http.impl.io.AbstractMessageParser.parse(AbstractMessageParser.java:259) ~[graylog.jar:?]
        at org.apache.http.impl.DefaultBHttpClientConnection.receiveResponseHeader(DefaultBHttpClientConnection.java:163) ~[graylog.jar:?]
        at org.apache.http.impl.conn.CPoolProxy.receiveResponseHeader(CPoolProxy.java:165) ~[graylog.jar:?]
        at org.apache.http.protocol.HttpRequestExecutor.doReceiveResponse(HttpRequestExecutor.java:273) ~[graylog.jar:?]
        at org.apache.http.protocol.HttpRequestExecutor.execute(HttpRequestExecutor.java:125) ~[graylog.jar:?]
        at org.apache.http.impl.execchain.MainClientExec.execute(MainClientExec.java:272) ~[graylog.jar:?]
        at org.apache.http.impl.execchain.ProtocolExec.execute(ProtocolExec.java:185) ~[graylog.jar:?]
        at org.apache.http.impl.execchain.RetryExec.execute(RetryExec.java:89) ~[graylog.jar:?]
        at org.apache.http.impl.execchain.RedirectExec.execute(RedirectExec.java:111) ~[graylog.jar:?]
        at org.apache.http.impl.client.InternalHttpClient.doExecute(InternalHttpClient.java:185) ~[graylog.jar:?]
        at org.apache.http.impl.client.CloseableHttpClient.execute(CloseableHttpClient.java:83) ~[graylog.jar:?]
        at org.apache.http.impl.client.CloseableHttpClient.execute(CloseableHttpClient.java:108) ~[graylog.jar:?]
        at io.searchbox.client.http.JestHttpClient.executeRequest(JestHttpClient.java:150) ~[graylog.jar:?]
        at io.searchbox.client.http.JestHttpClient.execute(JestHttpClient.java:77) ~[graylog.jar:?]
        at org.graylog2.indexer.cluster.jest.JestUtils.execute(JestUtils.java:47) ~[graylog.jar:?]
        ... 11 more
2017-10-18T20:00:35.958-05:00 ERROR [SystemJobManager] Unhandled error while running SystemJob <88890270-b460-11e7-927e-0050568a5665> [org.graylog2.indexer.indices.jobs.OptimizeIndexJob]
org.graylog2.indexer.ElasticsearchException: Couldn't force merge index userid_242
        at org.graylog2.indexer.cluster.jest.JestUtils.execute(JestUtils.java:52) ~[graylog.jar:?]
        at org.graylog2.indexer.indices.Indices.optimizeIndex(Indices.java:629) ~[graylog.jar:?]
        at org.graylog2.indexer.indices.jobs.OptimizeIndexJob.execute(OptimizeIndexJob.java:71) ~[graylog.jar:?]
        at org.graylog2.system.jobs.SystemJobManager$1.run(SystemJobManager.java:89) [graylog.jar:?]
        at com.codahale.metrics.InstrumentedScheduledExecutorService$InstrumentedRunnable.run(InstrumentedScheduledExecutorService.java:235) [graylog.jar:?]
        at java.util.concurrent.Executors$RunnableAdapter.call(Executors.java:511) [?:1.8.0_131]
        at java.util.concurrent.FutureTask.run(FutureTask.java:266) [?:1.8.0_131]
        at java.util.concurrent.ScheduledThreadPoolExecutor$ScheduledFutureTask.access$201(ScheduledThreadPoolExecutor.java:180) [?:1.8.0_131]
        at java.util.concurrent.ScheduledThreadPoolExecutor$ScheduledFutureTask.run(ScheduledThreadPoolExecutor.java:293) [?:1.8.0_131]
        at java.util.concurrent.ThreadPoolExecutor.runWorker(ThreadPoolExecutor.java:1142) [?:1.8.0_131]
        at java.util.concurrent.ThreadPoolExecutor$Worker.run(ThreadPoolExecutor.java:617) [?:1.8.0_131]
        at java.lang.Thread.run(Thread.java:748) [?:1.8.0_131]
Caused by: java.net.SocketTimeoutException: Read timed out
        at java.net.SocketInputStream.socketRead0(Native Method) ~[?:1.8.0_131]
        at java.net.SocketInputStream.socketRead(SocketInputStream.java:116) ~[?:1.8.0_131]
        at java.net.SocketInputStream.read(SocketInputStream.java:171) ~[?:1.8.0_131]
        at java.net.SocketInputStream.read(SocketInputStream.java:141) ~[?:1.8.0_131]
        at org.apache.http.impl.io.SessionInputBufferImpl.streamRead(SessionInputBufferImpl.java:137) ~[graylog.jar:?]
        at org.apache.http.impl.io.SessionInputBufferImpl.fillBuffer(SessionInputBufferImpl.java:153) ~[graylog.jar:?]
        at org.apache.http.impl.io.SessionInputBufferImpl.readLine(SessionInputBufferImpl.java:282) ~[graylog.jar:?]
        at org.apache.http.impl.conn.DefaultHttpResponseParser.parseHead(DefaultHttpResponseParser.java:138) ~[graylog.jar:?]
        at org.apache.http.impl.conn.DefaultHttpResponseParser.parseHead(DefaultHttpResponseParser.java:56) ~[graylog.jar:?]
        at org.apache.http.impl.io.AbstractMessageParser.parse(AbstractMessageParser.java:259) ~[graylog.jar:?]
        at org.apache.http.impl.DefaultBHttpClientConnection.receiveResponseHeader(DefaultBHttpClientConnection.java:163) ~[graylog.jar:?]
        at org.apache.http.impl.conn.CPoolProxy.receiveResponseHeader(CPoolProxy.java:165) ~[graylog.jar:?]
        at org.apache.http.protocol.HttpRequestExecutor.doReceiveResponse(HttpRequestExecutor.java:273) ~[graylog.jar:?]
        at org.apache.http.protocol.HttpRequestExecutor.execute(HttpRequestExecutor.java:125) ~[graylog.jar:?]
        at org.apache.http.impl.execchain.MainClientExec.execute(MainClientExec.java:272) ~[graylog.jar:?]
        at org.apache.http.impl.execchain.ProtocolExec.execute(ProtocolExec.java:185) ~[graylog.jar:?]
        at org.apache.http.impl.execchain.RetryExec.execute(RetryExec.java:89) ~[graylog.jar:?]
        at org.apache.http.impl.execchain.RedirectExec.execute(RedirectExec.java:111) ~[graylog.jar:?]
        at org.apache.http.impl.client.InternalHttpClient.doExecute(InternalHttpClient.java:185) ~[graylog.jar:?]
        at org.apache.http.impl.client.CloseableHttpClient.execute(CloseableHttpClient.java:83) ~[graylog.jar:?]
        at org.apache.http.impl.client.CloseableHttpClient.execute(CloseableHttpClient.java:108) ~[graylog.jar:?]
        at io.searchbox.client.http.JestHttpClient.executeRequest(JestHttpClient.java:150) ~[graylog.jar:?]
        at io.searchbox.client.http.JestHttpClient.execute(JestHttpClient.java:77) ~[graylog.jar:?]
        at org.graylog2.indexer.cluster.jest.JestUtils.execute(JestUtils.java:47) ~[graylog.jar:?]
        ... 11 more
2017-10-18T20:00:43.979-05:00 INFO  [MongoIndexRangeService] Calculated range of [userid_242] in [3608042ms].
2017-10-18T20:00:43.992-05:00 INFO  [CreateNewSingleIndexRangeJob] Created ranges for index userid_242.
2017-10-18T20:00:43.992-05:00 INFO  [SystemJobManager] SystemJob <76933b30-b460-11e7-927e-0050568a5665> [org.graylog2.indexer.indices.jobs.SetIndexReadOnlyAndCalculateRangeJob] finished in 3608260ms.
2017-10-18T20:00:48.557-05:00 INFO  [AbstractIndexCountBasedRetentionStrategy] Number of indices (3) higher than limit (2). Running retention for 1 indices.
2017-10-18T20:00:49.919-05:00 INFO  [AbstractIndexCountBasedRetentionStrategy] Running retention strategy [org.graylog2.indexer.retention.strategies.DeletionRetentionStrategy] for index <infoblox-named_39>
2017-10-18T20:00:53.936-05:00 INFO  [DeletionRetentionStrategy] Finished index retention strategy [delete] for index <infoblox-named_39> in 4014ms.
2017-10-18T20:00:54.018-05:00 INFO  [AbstractIndexCountBasedRetentionStrategy] Number of indices (3) higher than limit (2). Running retention for 1 indices.
2017-10-18T20:00:54.022-05:00 INFO  [AbstractIndexCountBasedRetentionStrategy] Running retention strategy [org.graylog2.indexer.retention.strategies.DeletionRetentionStrategy] for index <userid_241>
2017-10-18T20:00:54.833-05:00 INFO  [DeletionRetentionStrategy] Finished index retention strategy [delete] for index <userid_241> in 810ms.
Also concerning is the fact that I see UDP Buffer drops periodically on all nodes, when the systems already have pretty enlarged buffers…
The ES5 nodes each have 6 vCPU, 12GB memory with disk on an IBM XIV and they’re practically idle during that period where the force merges are happening. There is some extra disk traffic, but not incredible.
Using a shared network storage for database-like workloads is not ideal, as it introduces a heavy tax on I/O operations, adds network latency to each disk access, and also prevents any positive caching effect which Elasticsearch could profit of with local storage.
This is especially bad with I/O heavy operations such as optimizing (force merging) big Elasticsearch indices.
All excellent points @jochen, however at this moment in time I have little say in what it is placed on. In better news I seem to have been able to allay the pauses in processing and eliminate the timeouts on the master by reducing the size of the indices through storage-based retention rather than temporal-based retention. So instead of a 40GB index each day for some logs, we have 10GB indices rolling more frequently.
Also by moving up the UDP buffers from 0.25 MB to 1 MB, I seem to have been able to curtail some of the more egregious UDP packet drops that I was seeing, however I do still see a sprinkle of 4-5 UDP buffer drops on one of my nodes during a period where I do not appear to have any big bursts of traffic or processor usage. Should I go larger than 1MB with my UDP buffers on each UDP input?
Looking at that, it seems you probably are better off with 40GB indices with 1 primary shard and the necessary replicas. If you have 12G RAM, then 6G for elasticsearch means you can have max about 120 shards per ES node, so that it would still work OK.
If this is indeed the case, this is going to be a much larger problem, since shards that large are taking a lot longer than Graylog wants to wait, and still doesn’t explain why the master node is halting processing of messages during that time.
I had the same problem, that force merge took longer than 1 hour to finish. I used the same workaround, rotating indices faster. And after a couple of months, ES was almost dead; any search that spanned for several indices took ages to finish.
It is much better to adjust the index optimization timeout.
I think I would revert to the about 40G shards, and see what is the RAM requirement of ES nodes; by calculating how many shards you would have in the stable situation per node, and then multiply that by 0,1G. If you end up with larger than 64G RAM, you need more ES nodes.
I think you have way too many processors defined in the server.conf. If you have 4 single-threaded CPU:s in the machine, and define 37 processes for Graylog, that is too much. I think cutting that down to perhaps about 8 would improve the situation. That would already count for some I/O wait. Perhaps it needs even more scaling down. (I mean the outputbuffer_processors, processbuffer_processors, inputbuffer_processors)
If you need, you can instead increase the output_batch_size to get more throughput.
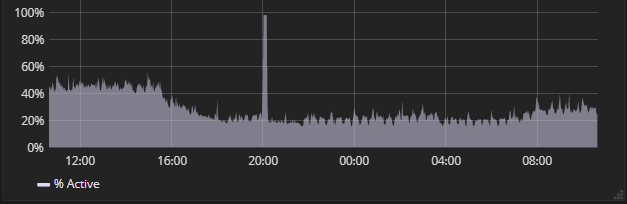
I hope that improves your situation. Looking at the graph you posted first, it seems that about 2 processing buffer processors would be the need in a normal situation (about 50% load in 4 processor node). So you would probably get away with fewer processing buffer processors.
I have no experience in the inputbuffer processor tweaking, so I cannot tell anything about that.
Nevertheless, if your graylog node uses time in context switching between different processes, it is not doing message processing. If you cannot reduce the number of processes, you should add more processors to the virtual machine.
If you can do 20,000 msg/s with a 4vCPU node, that’s something special @jtkarvo. If I lower my processors to your numbers, even 1700 msg/s per node and it backs up into the journal. Are you doing any actual log processing (grok extractions, etc)? I have significant amounts of complex patterns in pipelines, and my per-node processing numbers seem to take a steep dive if I cut my processors down any further than I have already.
The small increase from 2 to 4 on input buffer processors seems to have helped alleviate my remaining UDP input drops.
With the 20000 messages/second, 10000 batch size and 3 processors I referred to my outputbuffer configuration. I do have more processbuffer processes (and actual cores) in the node. So you can easily drop the number of output buffer processors by increasing the batch size, and free those resources to processing or input.
Did you tweak your heap size at all for Graylog to process that many msg/s? I’m having to add 2 more vCPU to each of my three nodes as my bursts are now going over what they can tolerate, and I’ve dropped tens of thousands of messages out of the UDP Buffer on all three nodes.
I have 8g heap for the Graylog JVM, but I don’t actually know if it is necessary; I might be able to live with less. I had at some point 12G JVM for Graylog, but that caused stalling due to GC. With the UDP packet dropping I can’t help you, I don’t know enough.
So I just had something interesting happen. One of my Elasticsearch cluster nodes went down, and at first Graylog seemed to keep on processing with the other node (which of course assumed the master role). However, shortly afterward it stopped processing completely and backed up millions of messages in the journal. In the logs was this…
2017-10-26T15:32:40.216-05:00 INFO  [RetryExec] I/O exception (java.net.NoRouteToHostException) caught when processing request to {}->http://elastic1.local:9200: No route to host (Host unreachable)
2017-10-26T15:32:40.216-05:00 INFO  [RetryExec] I/O exception (java.net.NoRouteToHostException) caught when processing request to {}->http://elastic1.local:9200: No route to host (Host unreachable)
2017-10-26T15:32:40.216-05:00 INFO  [RetryExec] Retrying request to {}->http://elastic1.local:9200
2017-10-26T15:32:40.216-05:00 INFO  [RetryExec] Retrying request to {}->http://elastic1.local:9200
2017-10-26T15:32:43.222-05:00 INFO  [RetryExec] I/O exception (java.net.NoRouteToHostException) caught when processing request to {}->http://elastic1.local:9200: No route to host (Host unreachable)
2017-10-26T15:32:43.222-05:00 INFO  [RetryExec] Retrying request to {}->http://elastic1.local:9200
2017-10-26T15:32:43.222-05:00 INFO  [RetryExec] I/O exception (java.net.NoRouteToHostException) caught when processing request to {}->http://elastic1.local:9200: No route to host (Host unreachable)
2017-10-26T15:32:43.222-05:00 INFO  [RetryExec] Retrying request to {}->http://elastic1.local:9200
2017-10-26T15:32:46.228-05:00 INFO  [RetryExec] I/O exception (java.net.NoRouteToHostException) caught when processing request to {}->http://elastic1.local:9200: No route to host (Host unreachable)
2017-10-26T15:32:46.228-05:00 INFO  [RetryExec] Retrying request to {}->http://elastic1.local:9200
2017-10-26T15:32:46.228-05:00 INFO  [RetryExec] I/O exception (java.net.NoRouteToHostException) caught when processing request to {}->http://elastic1.local:9200: No route to host (Host unreachable)
2017-10-26T15:32:46.228-05:00 INFO  [RetryExec] Retrying request to {}->http://elastic1.local:9200
2017-10-26T15:32:49.234-05:00 INFO  [RetryExec] I/O exception (java.net.NoRouteToHostException) caught when processing request to {}->http://elastic1.local:9200: No route to host (Host unreachable)
2017-10-26T15:32:49.234-05:00 INFO  [RetryExec] Retrying request to {}->http://elastic1.local:9200
2017-10-26T15:32:49.234-05:00 ERROR [IndexerClusterCheckerThread] Uncaught exception in periodical
org.graylog2.indexer.ElasticsearchException: Unable to read Elasticsearch node information
        at org.graylog2.indexer.cluster.jest.JestUtils.execute(JestUtils.java:52) ~[graylog.jar:?]
        at org.graylog2.indexer.cluster.jest.JestUtils.execute(JestUtils.java:63) ~[graylog.jar:?]
        at org.graylog2.indexer.cluster.Cluster.catNodes(Cluster.java:119) ~[graylog.jar:?]
        at org.graylog2.indexer.cluster.Cluster.getFileDescriptorStats(Cluster.java:124) ~[graylog.jar:?]
        at org.graylog2.periodical.IndexerClusterCheckerThread.doRun(IndexerClusterCheckerThread.java:56) ~[graylog.jar:?]
        at org.graylog2.plugin.periodical.Periodical.run(Periodical.java:77) [graylog.jar:?]
        at java.util.concurrent.Executors$RunnableAdapter.call(Executors.java:511) [?:1.8.0_131]
        at java.util.concurrent.FutureTask.runAndReset(FutureTask.java:308) [?:1.8.0_131]
        at java.util.concurrent.ScheduledThreadPoolExecutor$ScheduledFutureTask.access$301(ScheduledThreadPoolExecutor.java:180) [?:1.8.0_131]
        at java.util.concurrent.ScheduledThreadPoolExecutor$ScheduledFutureTask.run(ScheduledThreadPoolExecutor.java:294) [?:1.8.0_131]
        at java.util.concurrent.ThreadPoolExecutor.runWorker(ThreadPoolExecutor.java:1142) [?:1.8.0_131]
        at java.util.concurrent.ThreadPoolExecutor$Worker.run(ThreadPoolExecutor.java:617) [?:1.8.0_131]
        at java.lang.Thread.run(Thread.java:748) [?:1.8.0_131]
Caused by: java.net.NoRouteToHostException: No route to host (Host unreachable)
        at java.net.PlainSocketImpl.socketConnect(Native Method) ~[?:1.8.0_131]
        at java.net.AbstractPlainSocketImpl.doConnect(AbstractPlainSocketImpl.java:350) ~[?:1.8.0_131]
        at java.net.AbstractPlainSocketImpl.connectToAddress(AbstractPlainSocketImpl.java:206) ~[?:1.8.0_131]
        at java.net.AbstractPlainSocketImpl.connect(AbstractPlainSocketImpl.java:188) ~[?:1.8.0_131]
        at java.net.SocksSocketImpl.connect(SocksSocketImpl.java:392) ~[?:1.8.0_131]
        at java.net.Socket.connect(Socket.java:589) ~[?:1.8.0_131]
        at org.apache.http.conn.socket.PlainConnectionSocketFactory.connectSocket(PlainConnectionSocketFactory.java:75) ~[graylog.jar:?]
        at org.apache.http.impl.conn.DefaultHttpClientConnectionOperator.connect(DefaultHttpClientConnectionOperator.java:142) ~[graylog.jar:?]
        at org.apache.http.impl.conn.PoolingHttpClientConnectionManager.connect(PoolingHttpClientConnectionManager.java:359) ~[graylog.jar:?]
        at org.apache.http.impl.execchain.MainClientExec.establishRoute(MainClientExec.java:381) ~[graylog.jar:?]
        at org.apache.http.impl.execchain.MainClientExec.execute(MainClientExec.java:237) ~[graylog.jar:?]
        at org.apache.http.impl.execchain.ProtocolExec.execute(ProtocolExec.java:185) ~[graylog.jar:?]
        at org.apache.http.impl.execchain.RetryExec.execute(RetryExec.java:89) ~[graylog.jar:?]
        at org.apache.http.impl.execchain.RedirectExec.execute(RedirectExec.java:111) ~[graylog.jar:?]
        at org.apache.http.impl.client.InternalHttpClient.doExecute(InternalHttpClient.java:185) ~[graylog.jar:?]
        at org.apache.http.impl.client.CloseableHttpClient.execute(CloseableHttpClient.java:83) ~[graylog.jar:?]
        at org.apache.http.impl.client.CloseableHttpClient.execute(CloseableHttpClient.java:108) ~[graylog.jar:?]
        at io.searchbox.client.http.JestHttpClient.executeRequest(JestHttpClient.java:151) ~[graylog.jar:?]
        at io.searchbox.client.http.JestHttpClient.execute(JestHttpClient.java:77) ~[graylog.jar:?]
        at org.graylog2.indexer.cluster.jest.JestUtils.execute(JestUtils.java:47) ~[graylog.jar:?]
        ... 12 more
2017-10-26T15:32:52.240-05:00 INFO  [RetryExec] I/O exception (java.net.NoRouteToHostException) caught when processing request to {}->http://elastic1.local:9200: No route to host (Host unreachable)
2017-10-26T15:32:52.240-05:00 INFO  [RetryExec] Retrying request to {}->http://elastic1.local:9200
2017-10-26T15:32:52.240-05:00 ERROR [Messages] Caught exception during bulk indexing: java.net.NoRouteToHostException: No route to host (Host unreachable), retrying (attempt #2).
2017-10-26T15:32:53.630-05:00 INFO  [Messages] Bulk indexing finally successful (attempt #3).
2017-10-26T15:32:55.246-05:00 ERROR [IndexRotationThread] Couldn't point deflector to a new index
org.graylog2.indexer.ElasticsearchException: Couldn't collect aliases for index pattern iboss_*
        at org.graylog2.indexer.cluster.jest.JestUtils.execute(JestUtils.java:52) ~[graylog.jar:?]
        at org.graylog2.indexer.cluster.jest.JestUtils.execute(JestUtils.java:63) ~[graylog.jar:?]
        at org.graylog2.indexer.indices.Indices.getIndexNamesAndAliases(Indices.java:308) ~[graylog.jar:?]
        at org.graylog2.indexer.MongoIndexSet.getNewestIndexNumber(MongoIndexSet.java:151) ~[graylog.jar:?]
        at org.graylog2.indexer.MongoIndexSet.getNewestIndex(MongoIndexSet.java:146) ~[graylog.jar:?]
        at org.graylog2.periodical.IndexRotationThread.checkAndRepair(IndexRotationThread.java:156) ~[graylog.jar:?]
        at org.graylog2.periodical.IndexRotationThread.lambda$doRun$0(IndexRotationThread.java:76) ~[graylog.jar:?]
        at java.lang.Iterable.forEach(Iterable.java:75) [?:1.8.0_131]
        at org.graylog2.periodical.IndexRotationThread.doRun(IndexRotationThread.java:73) [graylog.jar:?]
        at org.graylog2.plugin.periodical.Periodical.run(Periodical.java:77) [graylog.jar:?]
        at java.util.concurrent.Executors$RunnableAdapter.call(Executors.java:511) [?:1.8.0_131]
        at java.util.concurrent.FutureTask.runAndReset(FutureTask.java:308) [?:1.8.0_131]
        at java.util.concurrent.ScheduledThreadPoolExecutor$ScheduledFutureTask.access$301(ScheduledThreadPoolExecutor.java:180) [?:1.8.0_131]
        at java.util.concurrent.ScheduledThreadPoolExecutor$ScheduledFutureTask.run(ScheduledThreadPoolExecutor.java:294) [?:1.8.0_131]
        at java.util.concurrent.ThreadPoolExecutor.runWorker(ThreadPoolExecutor.java:1142) [?:1.8.0_131]
        at java.util.concurrent.ThreadPoolExecutor$Worker.run(ThreadPoolExecutor.java:617) [?:1.8.0_131]
        at java.lang.Thread.run(Thread.java:748) [?:1.8.0_131]
Caused by: java.net.NoRouteToHostException: No route to host (Host unreachable)
        at java.net.PlainSocketImpl.socketConnect(Native Method) ~[?:1.8.0_131]
        at java.net.AbstractPlainSocketImpl.doConnect(AbstractPlainSocketImpl.java:350) ~[?:1.8.0_131]
        at java.net.AbstractPlainSocketImpl.connectToAddress(AbstractPlainSocketImpl.java:206) ~[?:1.8.0_131]
        at java.net.AbstractPlainSocketImpl.connect(AbstractPlainSocketImpl.java:188) ~[?:1.8.0_131]
        at java.net.SocksSocketImpl.connect(SocksSocketImpl.java:392) ~[?:1.8.0_131]
        at java.net.Socket.connect(Socket.java:589) ~[?:1.8.0_131]
        at org.apache.http.conn.socket.PlainConnectionSocketFactory.connectSocket(PlainConnectionSocketFactory.java:75) ~[graylog.jar:?]
        at org.apache.http.impl.conn.DefaultHttpClientConnectionOperator.connect(DefaultHttpClientConnectionOperator.java:142) ~[graylog.jar:?]
        at org.apache.http.impl.conn.PoolingHttpClientConnectionManager.connect(PoolingHttpClientConnectionManager.java:359) ~[graylog.jar:?]
        at org.apache.http.impl.execchain.MainClientExec.establishRoute(MainClientExec.java:381) ~[graylog.jar:?]
        at org.apache.http.impl.execchain.MainClientExec.execute(MainClientExec.java:237) ~[graylog.jar:?]
        at org.apache.http.impl.execchain.ProtocolExec.execute(ProtocolExec.java:185) ~[graylog.jar:?]
        at org.apache.http.impl.execchain.RetryExec.execute(RetryExec.java:89) ~[graylog.jar:?]
        at org.apache.http.impl.execchain.RedirectExec.execute(RedirectExec.java:111) ~[graylog.jar:?]
        at org.apache.http.impl.client.InternalHttpClient.doExecute(InternalHttpClient.java:185) ~[graylog.jar:?]
        at org.apache.http.impl.client.CloseableHttpClient.execute(CloseableHttpClient.java:83) ~[graylog.jar:?]
        at org.apache.http.impl.client.CloseableHttpClient.execute(CloseableHttpClient.java:108) ~[graylog.jar:?]
        at io.searchbox.client.http.JestHttpClient.executeRequest(JestHttpClient.java:151) ~[graylog.jar:?]
        at io.searchbox.client.http.JestHttpClient.execute(JestHttpClient.java:77) ~[graylog.jar:?]
        at org.graylog2.indexer.cluster.jest.JestUtils.execute(JestUtils.java:47) ~[graylog.jar:?]
        ... 16 more
2017-10-26T15:32:55.251-05:00 INFO  [RetryExec] I/O exception (java.net.NoRouteToHostException) caught when processing request to {}->http://elastic1.local:9200: No route to host (Host unreachable)
2017-10-26T15:32:55.251-05:00 INFO  [RetryExec] Retrying request to {}->http://elastic1.local:9200
2017-10-26T15:32:58.252-05:00 INFO  [RetryExec] I/O exception (java.net.NoRouteToHostException) caught when processing request to {}->http://elastic1.local:9200: No route to host (Host unreachable)
2017-10-26T15:32:58.252-05:00 INFO  [RetryExec] Retrying request to {}->http://elastic1.local:9200
2017-10-26T15:32:58.253-05:00 ERROR [Cluster] Couldn't read cluster health for indices [graylog_deflector, iboss_deflector, infoblox-dhcpd_deflector, infoblox-named_deflector, userid_deflector] (No route to host (Host unreachable))
Both nodes are plainly in the Graylog configuration…