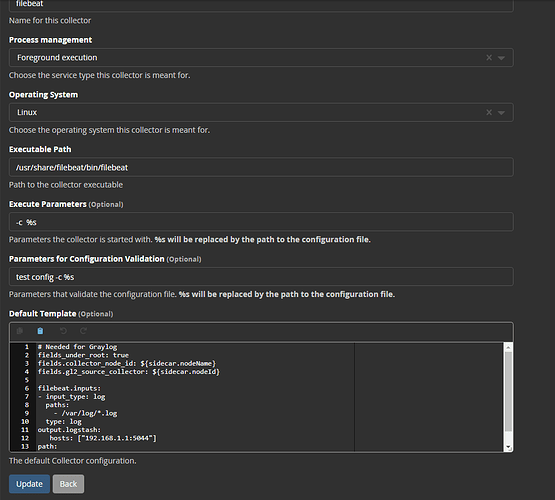
when i look at the sidecar.yml file it does show the hostname and port rather than the variable name so I know its passed correctly. I was adding the ip of graylog server have not FQDN it. But still no luck
In the filebeat logs do you get the same error and warning?
-09-01T17:17:27.532+0100    ERROR   [modules]       fileset/modules.go:131  Not loading modules. Module directory not found: /usr/share/filebeat/bin/modu
le
2021-09-01T17:17:27.532+0100    WARN    beater/filebeat.go:178  Filebeat is unable to load the Ingest Node pipelines for the configured modules because the E
lasticsearch output is not configured/enabled. If you have already loaded the Ingest Node pipelines or are using Logstash pipelines, you can ignore this warn
ing.
2021-09-01T17:17:27.532+0100    INFO    [monitoring]    log/log.go:118  Starting metrics logging every 30s
2021-09-01T17:17:27.532+0100    INFO    instance/beat.go:473    filebeat start running.
2021-09-01T17:17:27.533+0100    INFO    memlog/store.go:119     Loading data file of '/var/lib/graylog-sidecar/collectors/filebeat/data/registry/filebeat' su
cceeded. Active transaction id=0
2021-09-01T17:17:27.533+0100    INFO    memlog/store.go:124     Finished loading transaction log file for '/var/lib/graylog-sidecar/collectors/filebeat/data/
registry/filebeat'. Active transaction id=0
2021-09-01T17:17:27.533+0100    WARN    beater/filebeat.go:381  Filebeat is unable to load the Ingest Node pipelines for the configured modules because the Elasticsearch output is not configured/enabled. If you have already loaded the Ingest Node pipelines or are using Logstash pipelines, you can ignore this warning.
2021-09-01T17:17:27.533+0100    INFO    [registrar]     registrar/registrar.go:109      States Loaded from registrar: 0
2021-09-01T17:17:27.533+0100    INFO    [crawler]       beater/crawler.go:71    Loading Inputs: 1
2021-09-01T17:17:27.534+0100    INFO    [input] log/input.go:164        Configured paths: [/Volumes/assets/logs/dataiosync/*.log]       {"input_id": "722946cc-0a47-4d24-91f8-60f24895bca8"}
2021-09-01T17:17:27.534+0100    INFO    [crawler]       beater/crawler.go:141   Starting input (ID: 17263810949623282385)
Do you know if filebeat is TCP or UDP?
I was talking about the Collector Configuration in the Graylog UI.
filebeat logs - never configured for them - since sidecar manages starting and stopping the filebeat binary I would usually be looking at sidecar logs.
so logs i was looking at are for sidecar filebeat
logs: /var/lib/graylog-sidecar/collectors/filebeat/log/filebeat - it seems to append to the log
collector config in the collector configuration is
# Needed for Graylog
fields_under_root: true
fields.collector_node_id: ${sidecar.nodeName}
fields.gl2_source_collector: ${sidecar.nodeId}

filebeat.inputs:
- type: log
  enabled: true
  paths:
    - /Volumes/assets/logs/dataiosync/*.log
output.logstash:
   hosts:
   - ${user.BeatsInput}
path:
  data: /var/lib/graylog-sidecar/collectors/filebeat/data
  logs: /var/lib/graylog-sidecar/collectors/filebeat/log
When I create this beats input do i need to configure it in anyway or just add the port and Title. Because this is all I did. Same I did for my syslog and they seem to work.
So finally got it too work. Basically I had a folder for my logs in /Volumes/assets/logs/dataiosync/dated folders of logs/.log file
It did not like this dated folders. I did a test and move the log up a directory and then I saw data being ingested. What a pain. Do you know how I can specify a dated folder. Would this work
/Volumes/assets/logs/dataiosync//.log?
I misundersood, yes, I have a filebeat log file in my graylog-sidecar configuration logfile path: /var/log/graylog-sidecar I see similar errors on startup but they don’t seem to effect Graylog.
You can poke around on the Elasticsearch support area for details on beats, and what you can do with them.
I believe it is possible to watch multiple sub directories with:
  paths:
    - /Volumes/assets/logs/dataiosync/*.log
    - /Volumes/assets/logs/dataiosync/*/*.log
This works now thanks. Picks up all the multiple sub directories.
Im not sure if this thread should be the one. But I was wondering about log formatting for logs from beat coming into graylog.
Currently all the fields in my log file such as key value and the output value for these fields all come under messages. example DEST_PATH:/Volumes/assets. This whole line comes in messages and no differentiation between the key field DEST_PATH: and the output of that field /Volumes/assets.
Is there a better way to get say all of the log info in one message displaying all the key fields separtely so that when i click on the key field i then see a drop down with the value.
My syslog come in correctly as I have specified it as RSYSLOG_SyslogProtocol23Format for other workstations.
Thank you, this is what I did as well.
Also my log file is a live log file so when data is being rsynced it is constantly writing to the log file which is being picked up by graylog
It would be best to start a new topic for this question.
If you want to break out more information from the message, you can either use an extractor or a pipeline rule.
I have no idea what you mean by use an extractor or a pipeline rule, how do i do that? and does that make a new ticket?
Forum questions are answered by other Graylog users who wish to help and do so in their spare time.
“How do I do that?” - Read through documentation, search for answers to your questions in the forum before asking them, read blog posts, google your questions on the internet…
I did that is why i asked a question on here.
Plus everyone in this forum has a different level of understanding. You mentioned to use a extractor. If I have never used it and you mentioned it, its just easier to ask you.
This topic was automatically closed 14 days after the last reply. New replies are no longer allowed.
