Before you post: Your responses to these questions will help the community help you. Please complete this template if you’re asking a support question.
Don’t forget to select tags to help index your topic!
1. Describe your incident:
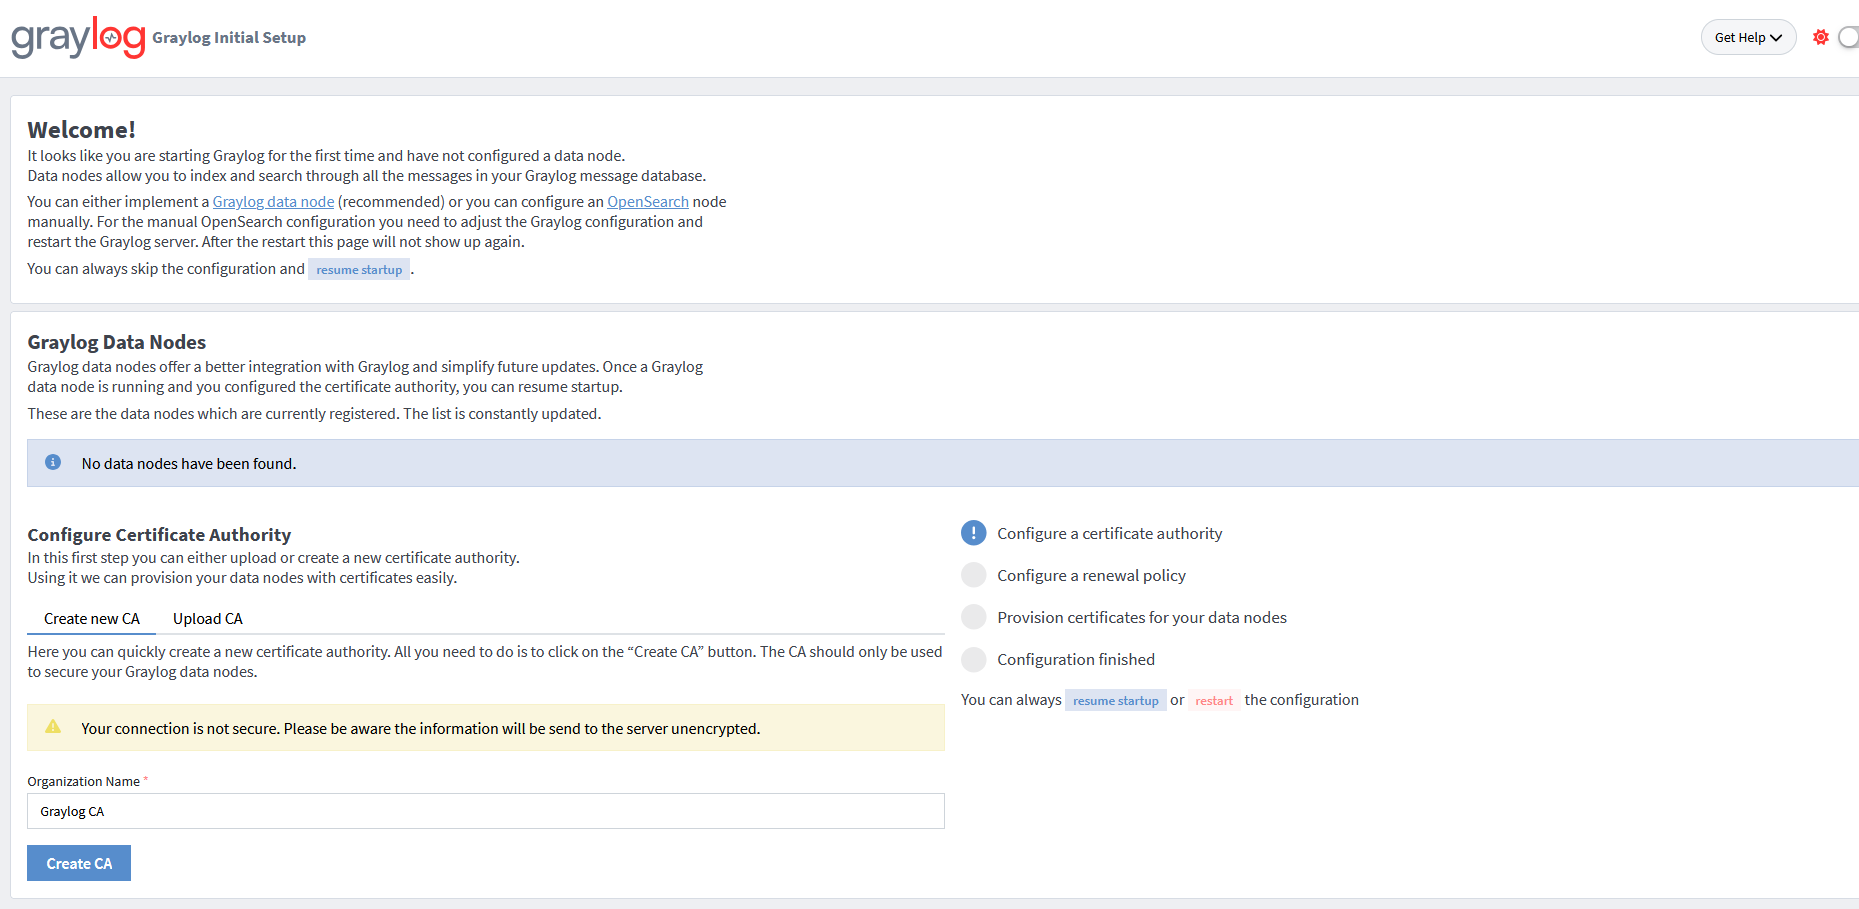
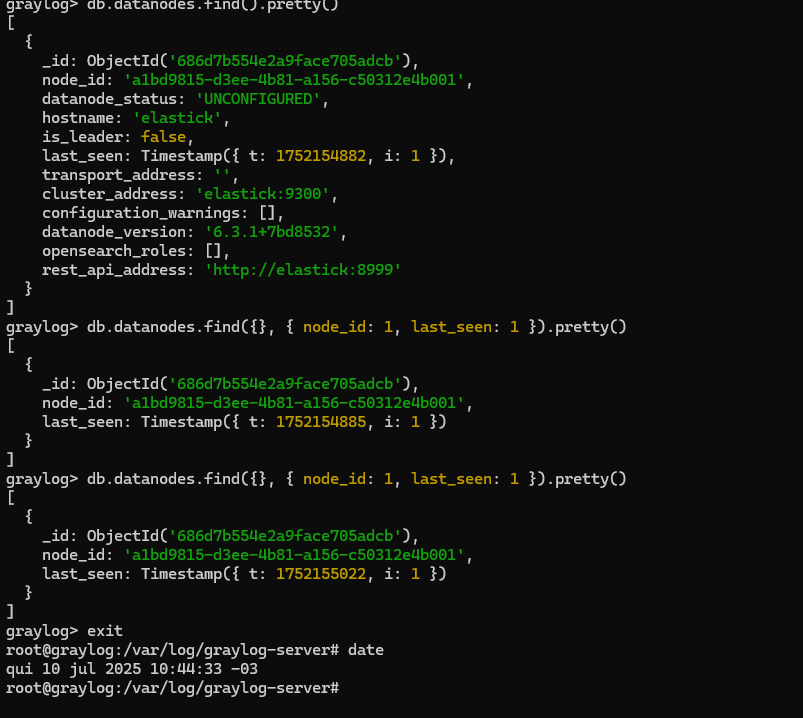
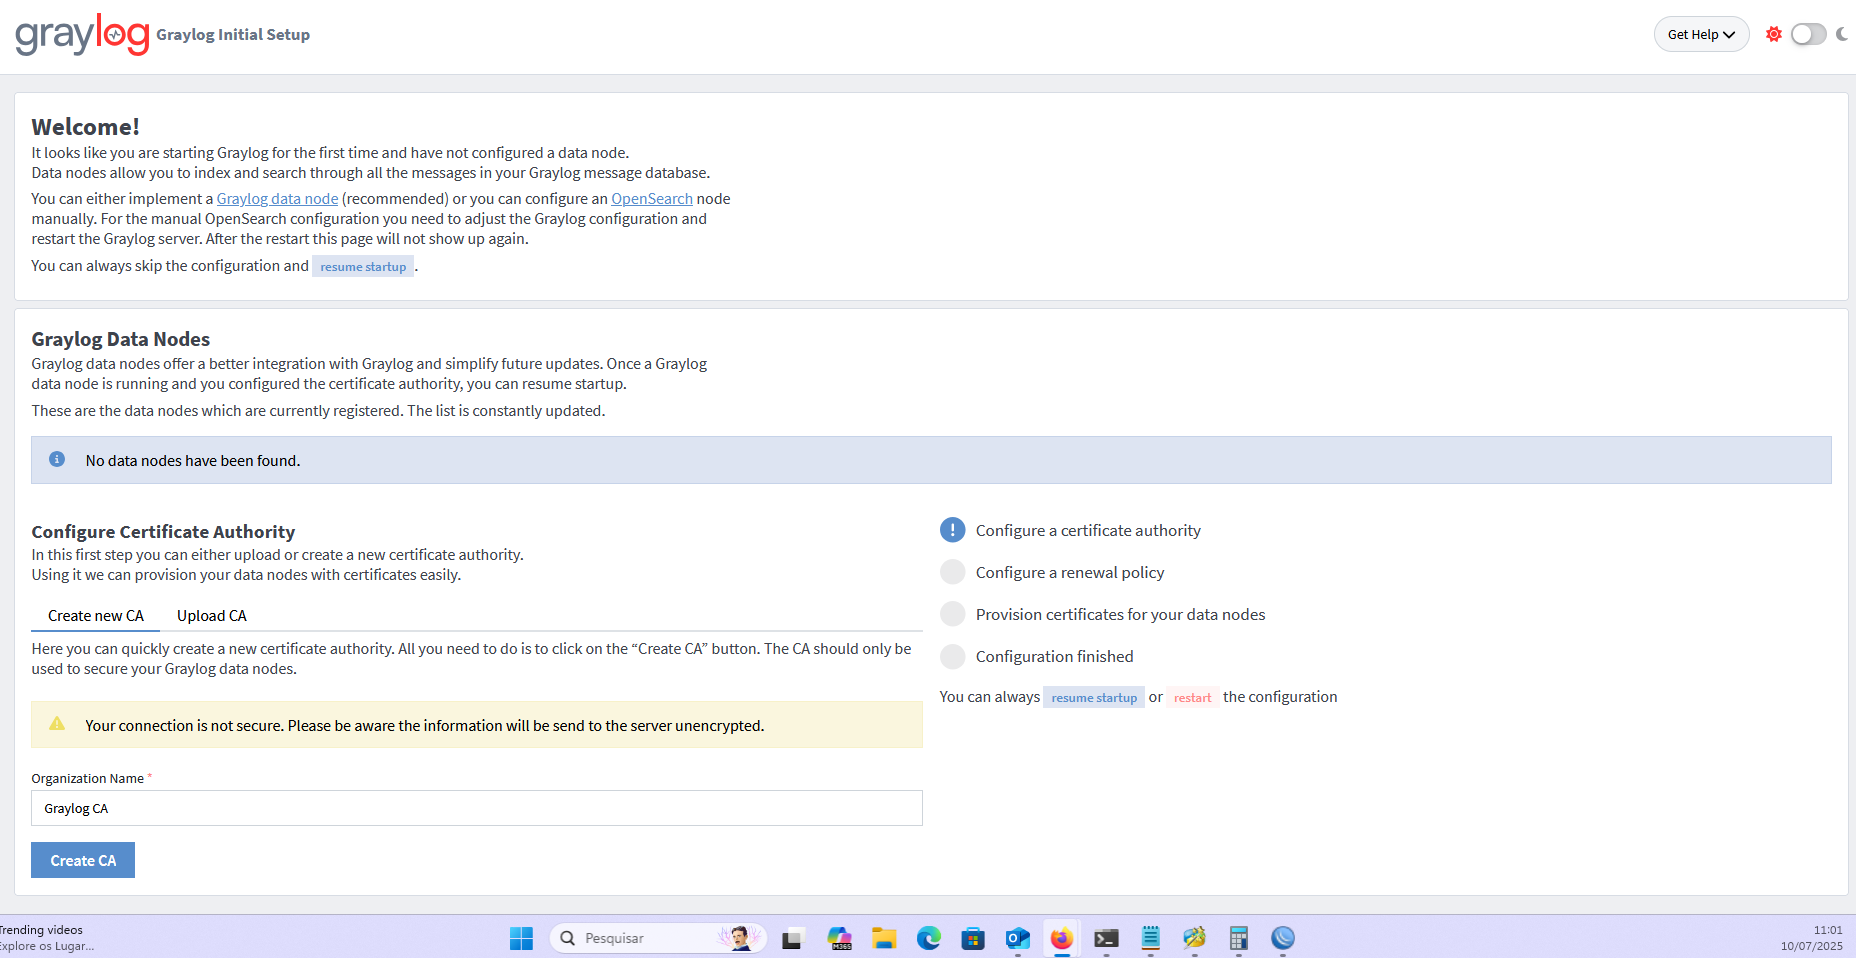
I’m setting up a Graylog 6.3 environment with a separate Data Node. However, the Data Node does not appear in the Graylog Server’s preflight configuration interface. Both servers can communicate with each other, MongoDB is correctly configured and accessible, and all services are running, but the Data Node is still not detected in the UI.
2. Describe your environment:
*Ubuntu 24
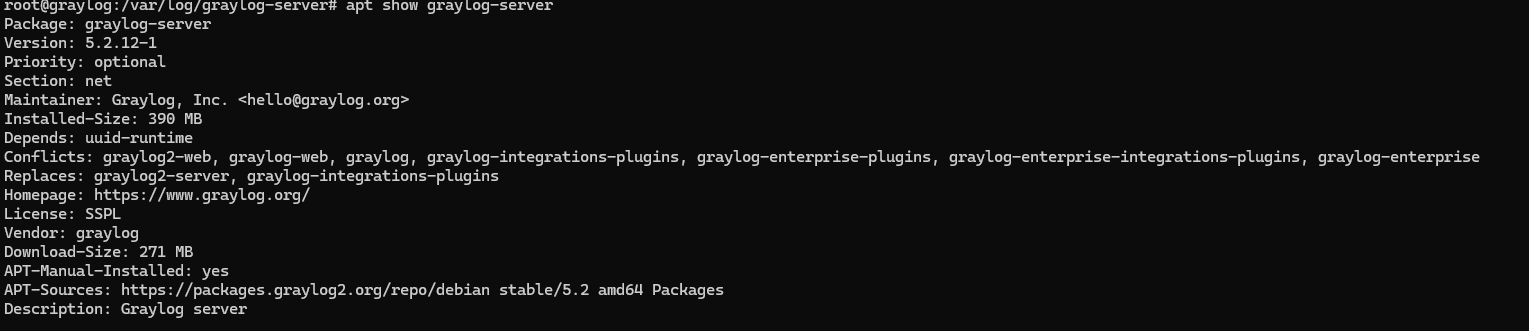
- Package Version:
6.3 - Service logs, configurations, and environment variables:
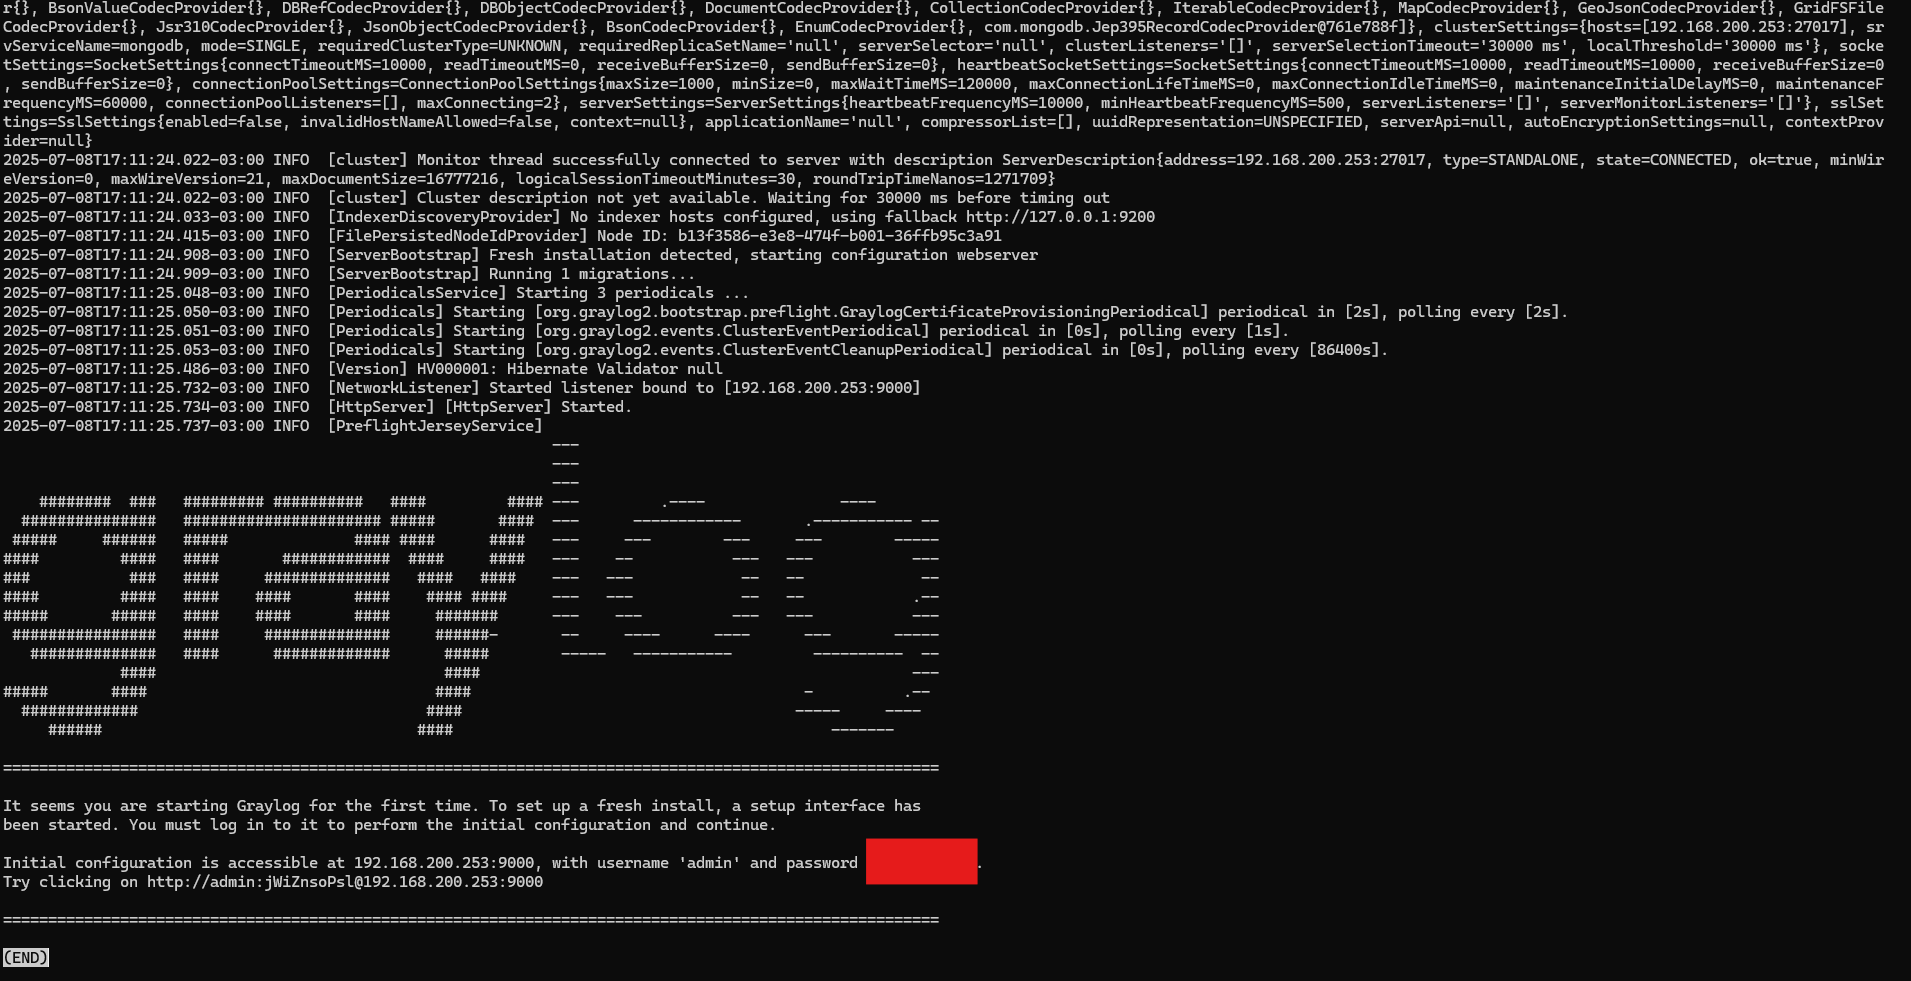
server.log
========================================================================================================
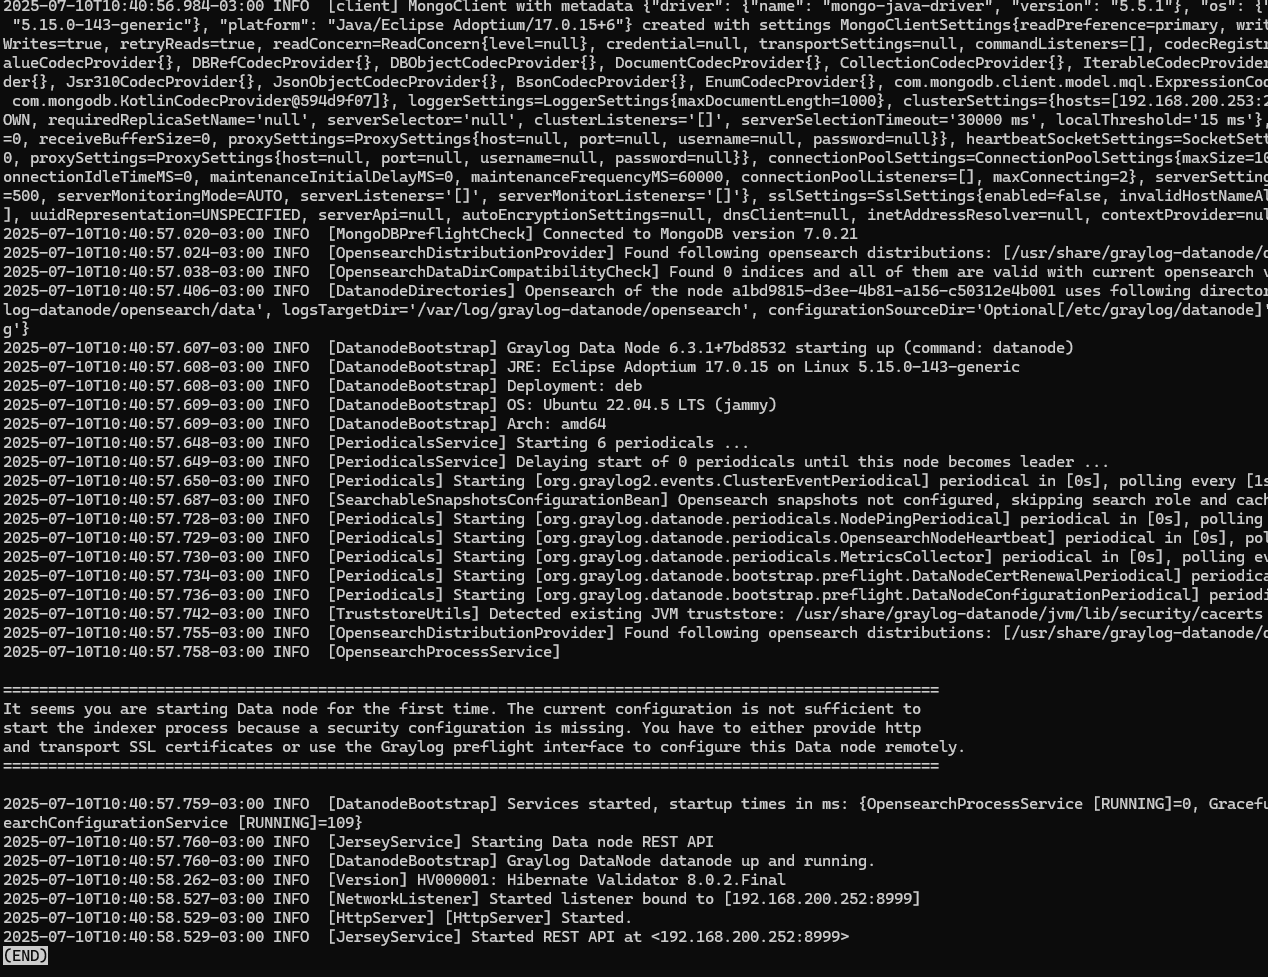
It seems you are starting Graylog for the first time. To set up a fresh install, a setup interface has
been started. You must log in to it to perform the initial configuration and continue.
Initial configuration is accessible at 192.168.200.253:9000, with username ‘admin’ and password ‘SLiwAgnYxj’.
Try clicking on http ://admin:SLiwAgnYxj@192.168.200.253:9000
========================================================================================================
(END)
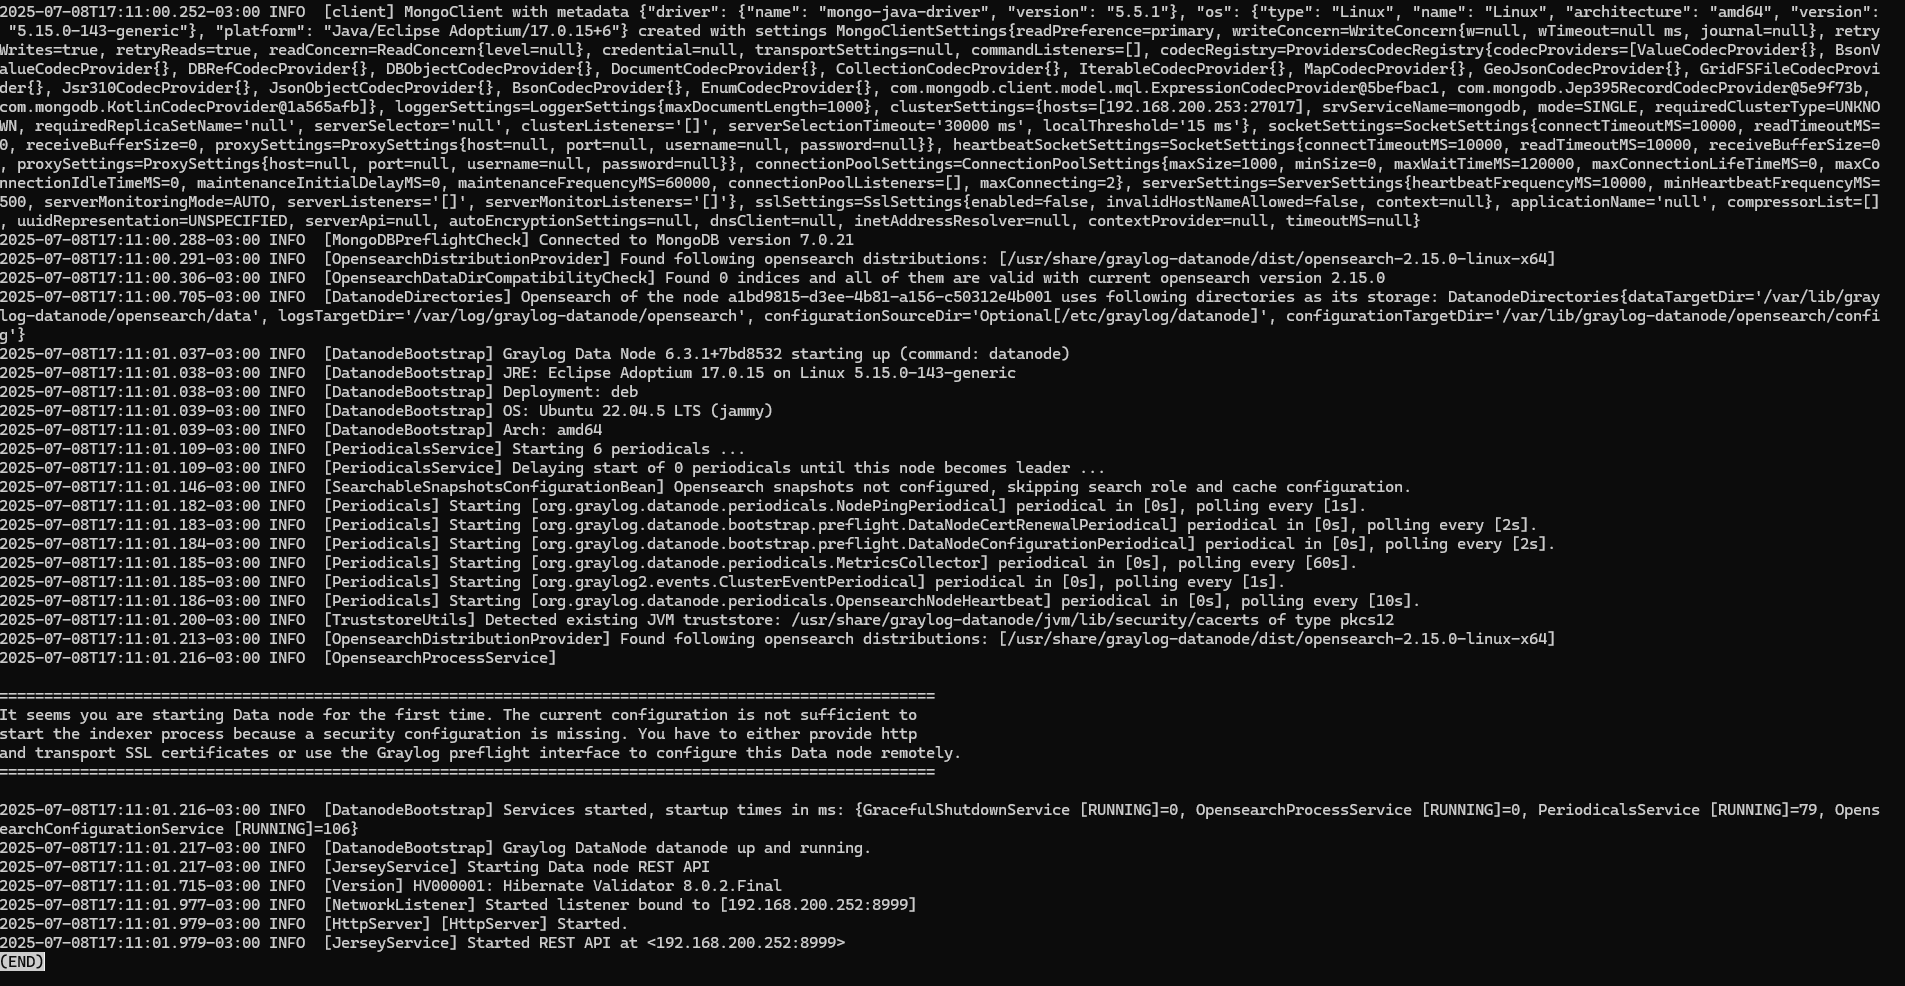
datanode
2025-07-08T10:14:53.352-03:00 INFO [JerseyService] Starting Data node REST API
2025-07-08T10:14:53.352-03:00 INFO [DatanodeBootstrap] Services started, startup times in ms: {GracefulShutdownService [RUNNING]=0, OpensearchProcessService [RUNNING]=0, PeriodicalsService [RUNNING]=68, OpensearchConfigurationService [RUNNING]=106}
2025-07-08T10:14:53.353-03:00 INFO [DatanodeBootstrap] Graylog DataNode datanode up and running.
2025-07-08T10:14:53.857-03:00 INFO [Version] HV000001: Hibernate Validator 8.0.2.Final
2025-07-08T10:14:54.119-03:00 INFO [NetworkListener] Started listener bound to [192.168.200.252:8999]
2025-07-08T10:14:54.121-03:00 INFO [HttpServer] [HttpServer] Started.
2025-07-08T10:14:54.121-03:00 INFO [JerseyService] Started REST API at <192.168.200.252:8999>
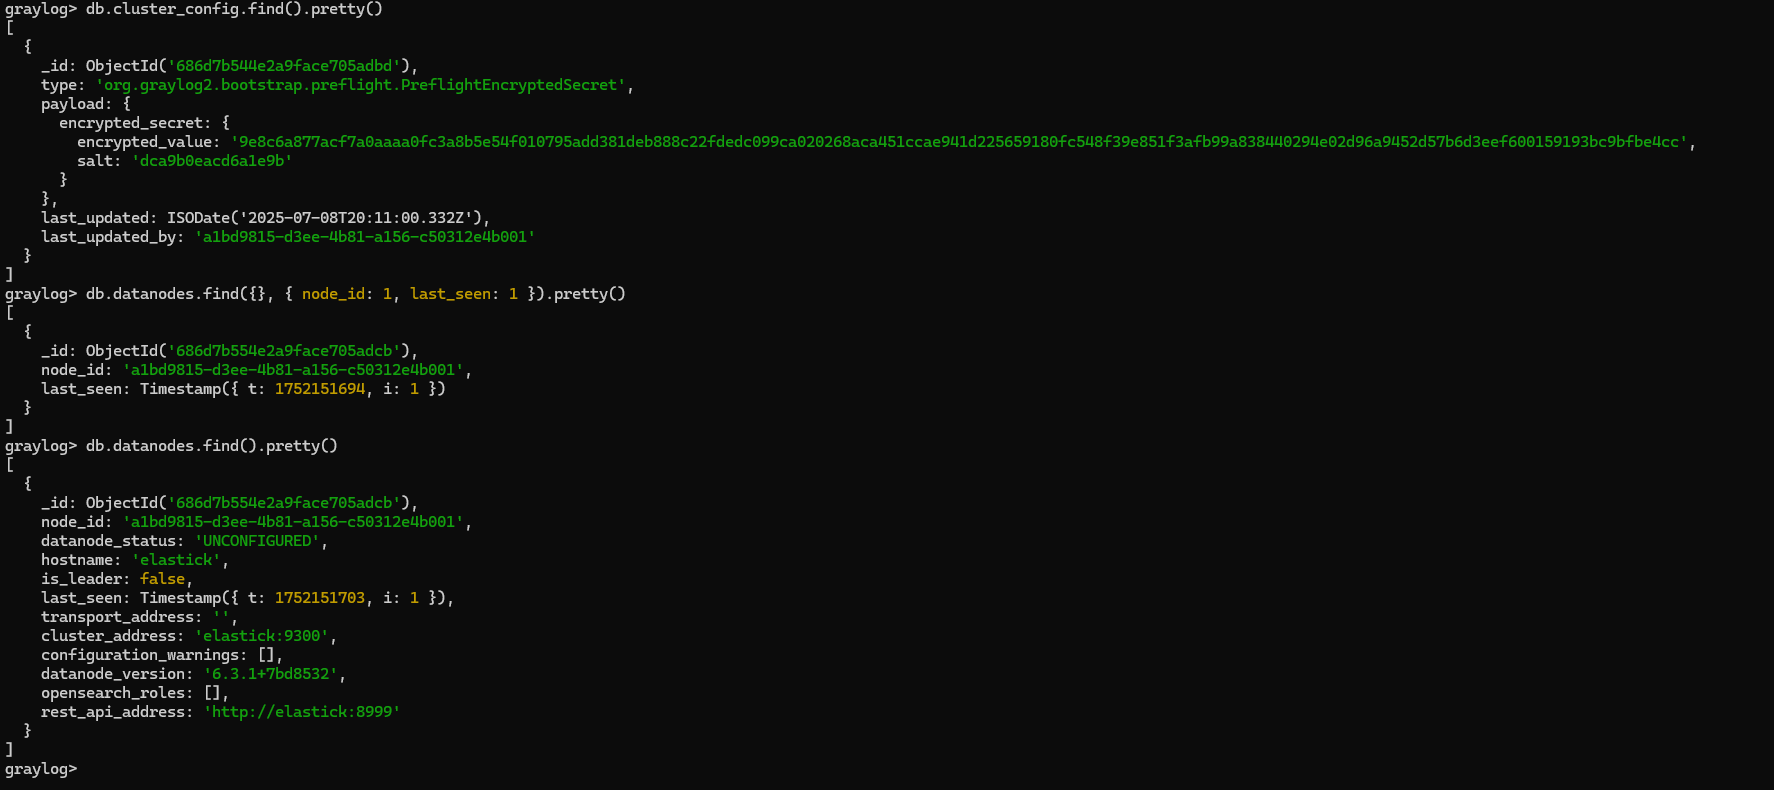
Curl from graylog-server node to datanode port 8999 returns
curl http ://elastick:8999
root@graylog:/var/log/graylog-server# curl http ://elastick:8999
{“operating_system”:{“os_name”:“Linux”,“os_version”:“5.15.0-143-generic”,“java_version”:“17.0.15”,“user_name”:“graylog-datanode”},“opensearch”:{“opensearch_version”:“2.15.0”,“node”:{“node_name”:“elastick”,“state”:“WAITING_FOR_CONFIGURATION”,“rest_base_url”:“”,“process”:{“pid”:-1,“alive”:false,“started”:null}}},“datanode_directories”:{“data_target_dir”:“file:///var/lib/graylog-datanode/opensearch/data/”,“logs_target_dir”:“file:///var/log/graylog-datanode/opensearch/”,“configuration_source_dir”:“file:///etc/graylog/datanode/”,“configuration_target_dir”:“file:///var/lib/graylog-datanode/opensearch/config/”},“dto”:{“status”:“UNCONFIGURED”,“error_msg”:null,“cert_valid_until”:null,“data_node_status”:“UNCONFIGURED”,“cert_valid_until”:null,“cluster_address”:“elastick:9300”,“rest_api_address”:“http://elastick:8999”,“action_queue”:null,“datanode_version”:“6.3.1+7bd8532”,“opensearch_roles”:,“configuration_warnings”:,“version_compatible”:true,“id”:“a1bd9815-d3ee-4b81-a156-c50312e4b001”,“is_leader”:false,“node_id”:“a1bd9815-d3ee-4b81-a156-c50312e4b001”,“short_node_id”:“a1bd9815”,“transport_address”:“”,“hostname”:“elastick”,“last_seen”:“2025-07-08T13:34:38.000Z”,“object_id”:“686d19cd4e2a9face703102c”,“is_master”:false},“data_node_version”:“6.3.1+7bd8532”}root@graylog:/var/log/graylog-server#