
Amazon AWS
Plugin 2.4.5
Several bundled Graylog plugins to integrate with different AWS services like CloudTrail and FlowLogs.
Download from Github
View on Github
Issues
Stargazers
This plugin provides the following Graylog modules:
- Input plugin for AWS Flow Logs network interface connection logs. NOTE: This input has been deprecated in favor of the new AWS Kinesis/CloudWatch input in graylog-integrations-plugin.
- Input plugin for AWS Logs General CloudWatch logs. NOTE: This input has been deprecated in favor of the new AWS Kinesis/CloudWatch input in graylog-integrations-plugin.
- Input plugin for AWS CloudTrail configuration change logs.
This plugin provides the following functionality:
- AWS Logs input: Reads a stream of CloudWatch logs from a specific AWS CloudWatch log group matching a particular log filter pattern.
- AWS Flow Logs input: Reads a stream of network flow logs for a VPC, subnet, or network interface.
- AWS entity translation: Looks up data for an an AWS entity.
Graylog Version Compatibility
| Plugin Version | Graylog Version |
|---|---|
| 3.0.x | 3.0.x |
| 2.5.x | 2.5.x |
| 2.4.x | 2.4.x |
| 2.3.x | 2.3.x |
| 1.3.2 | 2.2.2 |
| 1.2.1 | 2.1.3 |
| 0.6.0 | 2.0.x |
Installation
Since Graylog Version 2.4.0 this plugin is already included in the Graylog server installation package as default plugin.
Download the plugin and place the .jar file in your Graylog plugin directory. The plugin directory is the plugins/ folder relative from your graylog-server directory by default and can be configured in your graylog.conf file.
Restart graylog-server and you are done.
General setup
After installing the plugin you will have a new cluster configuration section at “System → Configurations” in your Graylog Web Interface. Make sure to complete the configuration before using any of the modules this plugin provides. You’ll see a lot of warnings in your graylog-server log file if you fail to do so.
Note that the AWS access and secret key are currently not stored encrypted. This feature is following shortly and before the final release of v1.0 of this plugin.
AWS entity translation
The configuration of this plugin has a parameter that controls if AWS entity translations are supposed to be attempted or not. This basically means that the plugin will try to find certain fields like a source IP address and enrich the log message with more information about the AWS entity (like a EC2 box, an ELB instance, a RDS database, …) automatically.
This would look something like this:
![]()
IAM permissions required to use this feature:
{
    "Version": "2012-10-17",
    "Statement": [
        {
            "Sid": "Stmt1469415911000",
            "Effect": "Allow",
            "Action": [
                "elasticloadbalancing:DescribeLoadBalancerAttributes",
                "elasticloadbalancing:DescribeLoadBalancers"
            ],
            "Resource": [
                "*"
            ]
        },
        {
            "Sid": "Stmt1469415936000",
            "Effect": "Allow",
            "Action": [
                "ec2:DescribeInstances",
                "ec2:DescribeNetworkInterfaceAttribute",
                "ec2:DescribeNetworkInterfaces"
            ],
            "Resource": [
                "*"
            ]
        }
    ]
}
AWS Flow Logs/AWS Logs
Graylog supports the ability to read AWS Cloudwatch logs regardless of where they originated from. As long as the logs end up in a constant CloudWatch log group, then Graylog should be able to read them. The log messages for a particular CloudWatch log group must be forwarded to a Kinesis stream (via CloudWatch Subscription filters) from which Graylog will be able to read and process them. Using a Kinesis stream allows Graylog the ability to sequentially read the log messages. If the input is temporarily stopped, then started again, the input will continue reading messages were it left off (as long as the data retention period on the Kinesis stream is large enough).
AWS Flow Logs and AWS Logs inputs both read logs from CloudWatch log groups. However, the AWS Flow Logs input internally uses a special decoder that parses fields from each message according to the AWS flow log message format.
The AWS Logs input automatically parses the aws_log_group and aws_log_stream fields, and leaves the remaining field extraction up to the user to define.
Several flow logs integration and analysis examples are described in this graylog.org blog post.
Preparation:
This input uses the AWS SDK to communicate with various AWS resources. Therefore, HTTPS communication must be permitted between the Graylog server and each of the resources. If communication on the network segment containing the Graylog cluster is restricted, please make sure that communication to the following endpoints is explicitly permitted.
monitoring.<region>.amazonaws.com
cloudtrail.<region>.amazonaws.com
dynamodb.<region>.amazonaws.com
kinesis.<region>.amazonaws.com
logs.<region>.amazonaws.com
Step 1: Enable Flow Logs
This step is only needed when setting up the AWS Flow Logs input (skip if setting up the AWS logs input). There are two ways to enable Flow Logs for an AWS network interface:
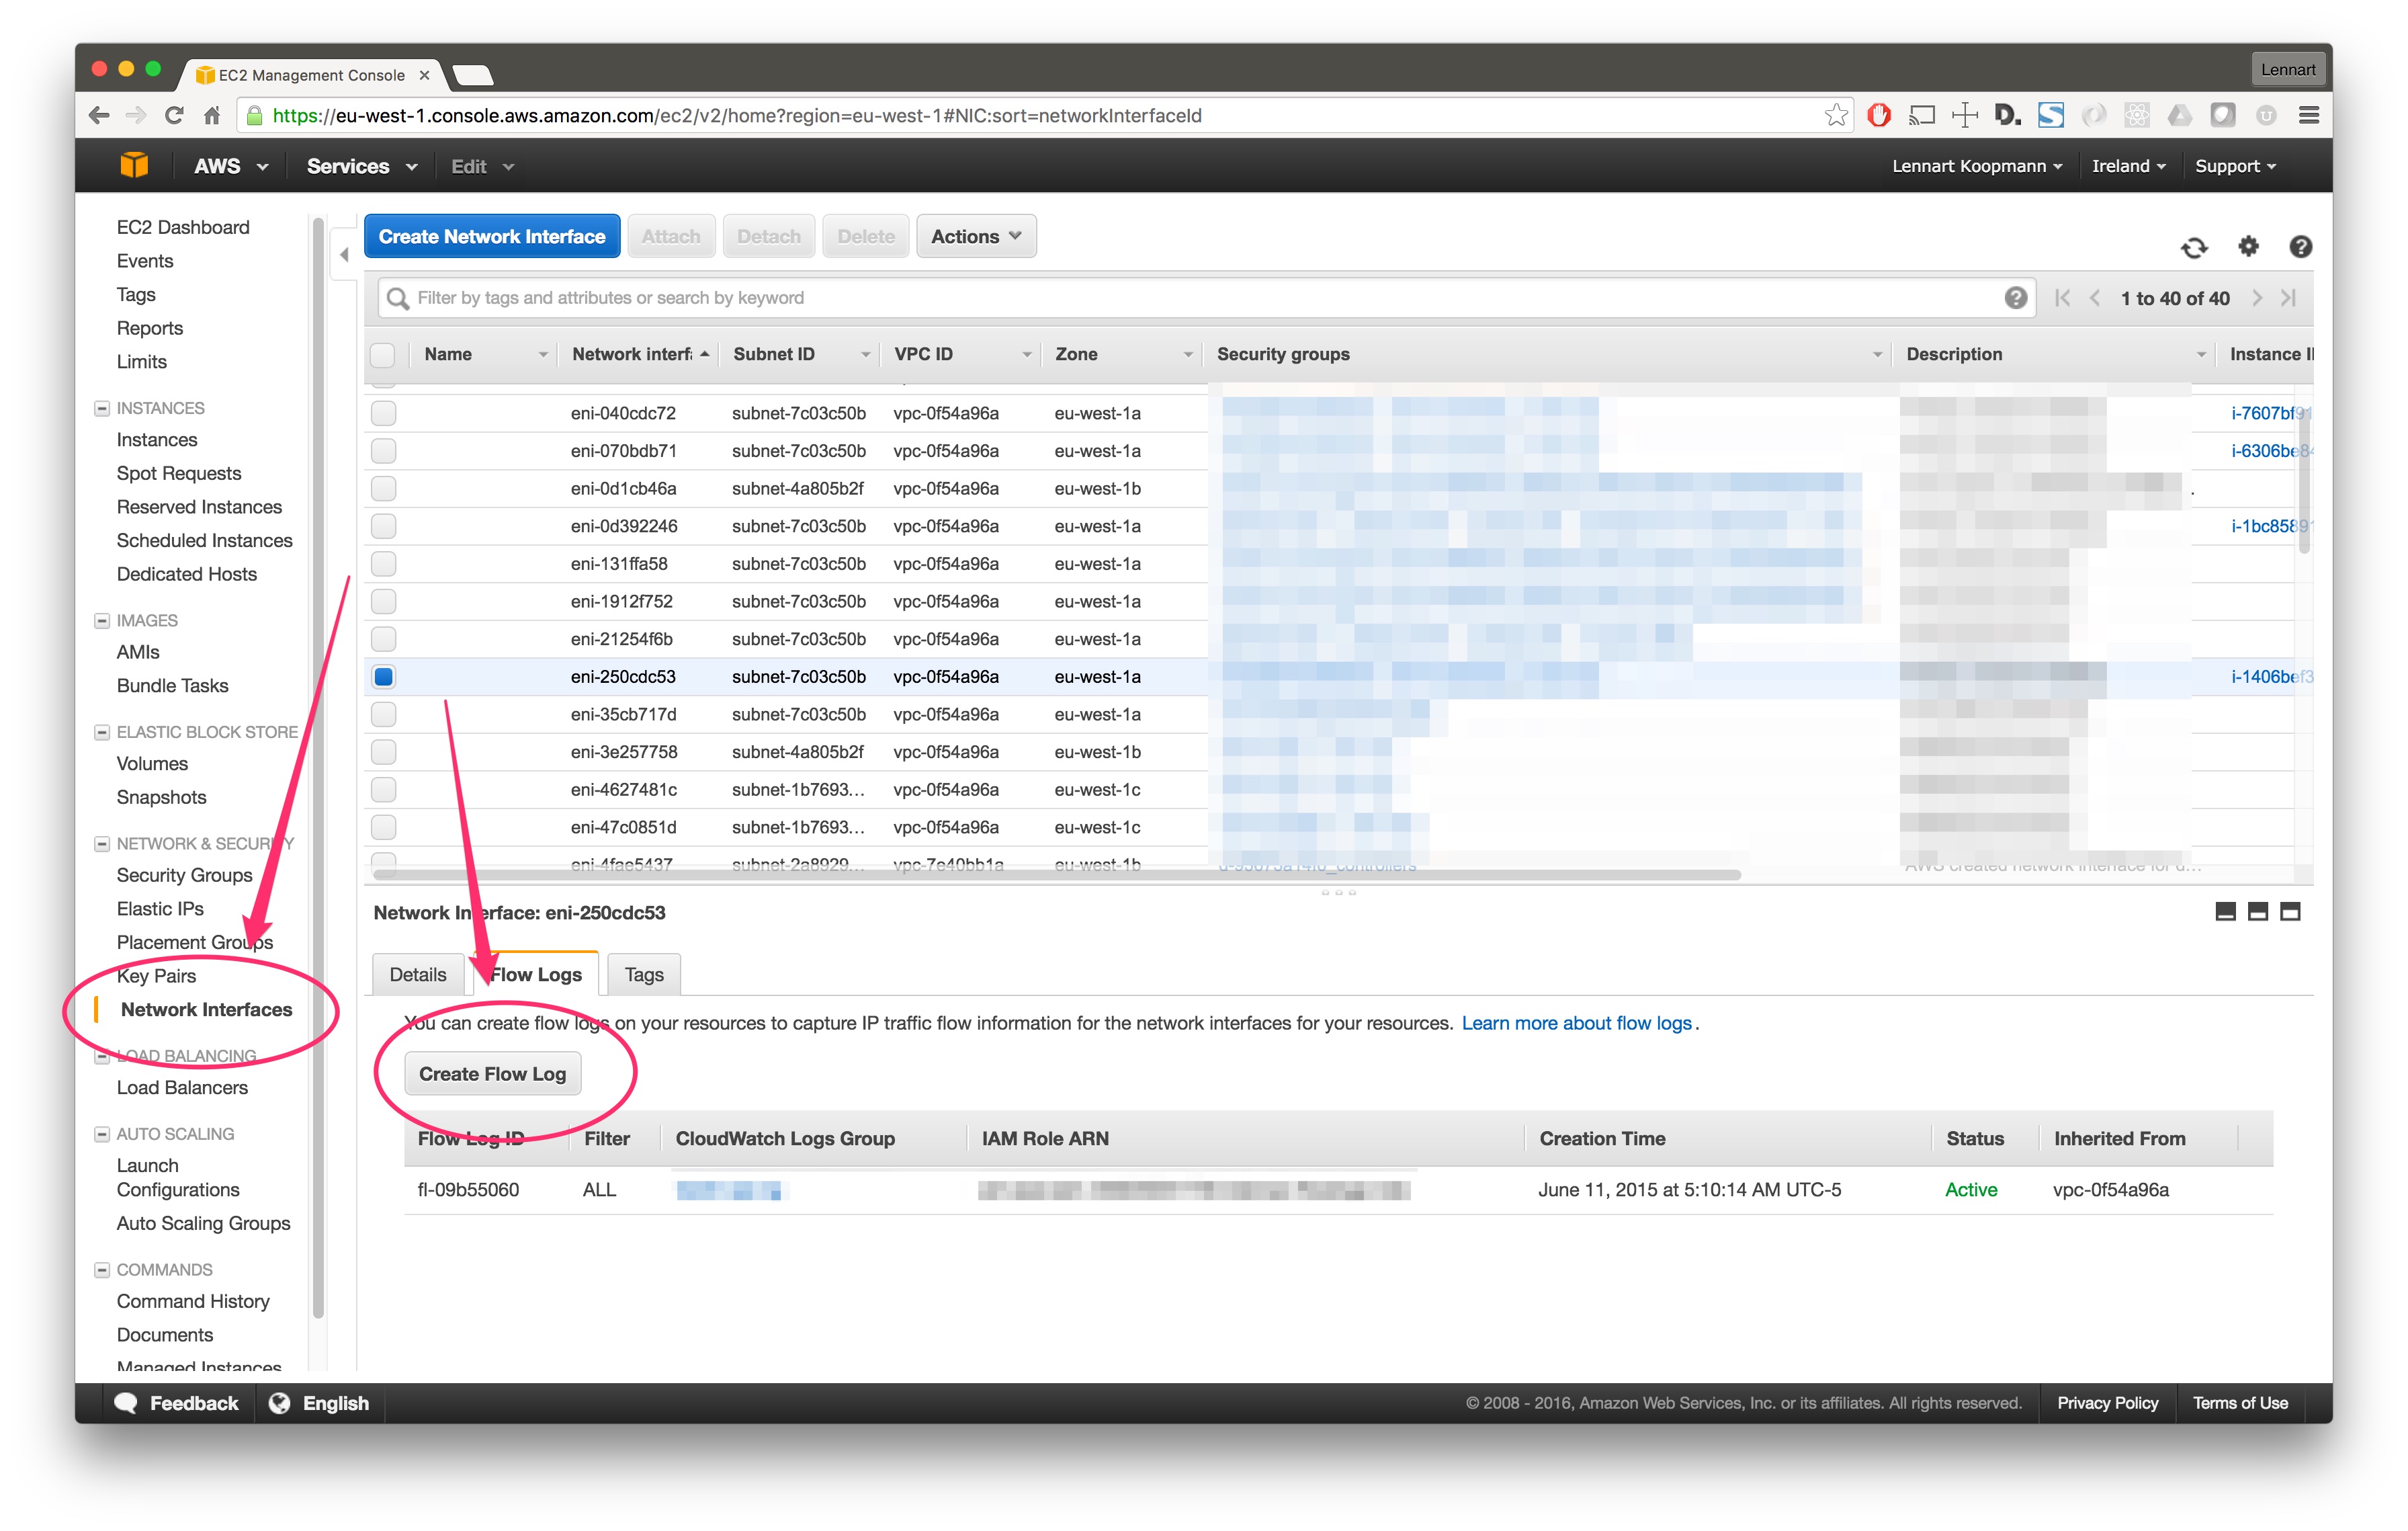
For a specific network interface in your EC2 console, under the “Network Interfaces” main navigation link:
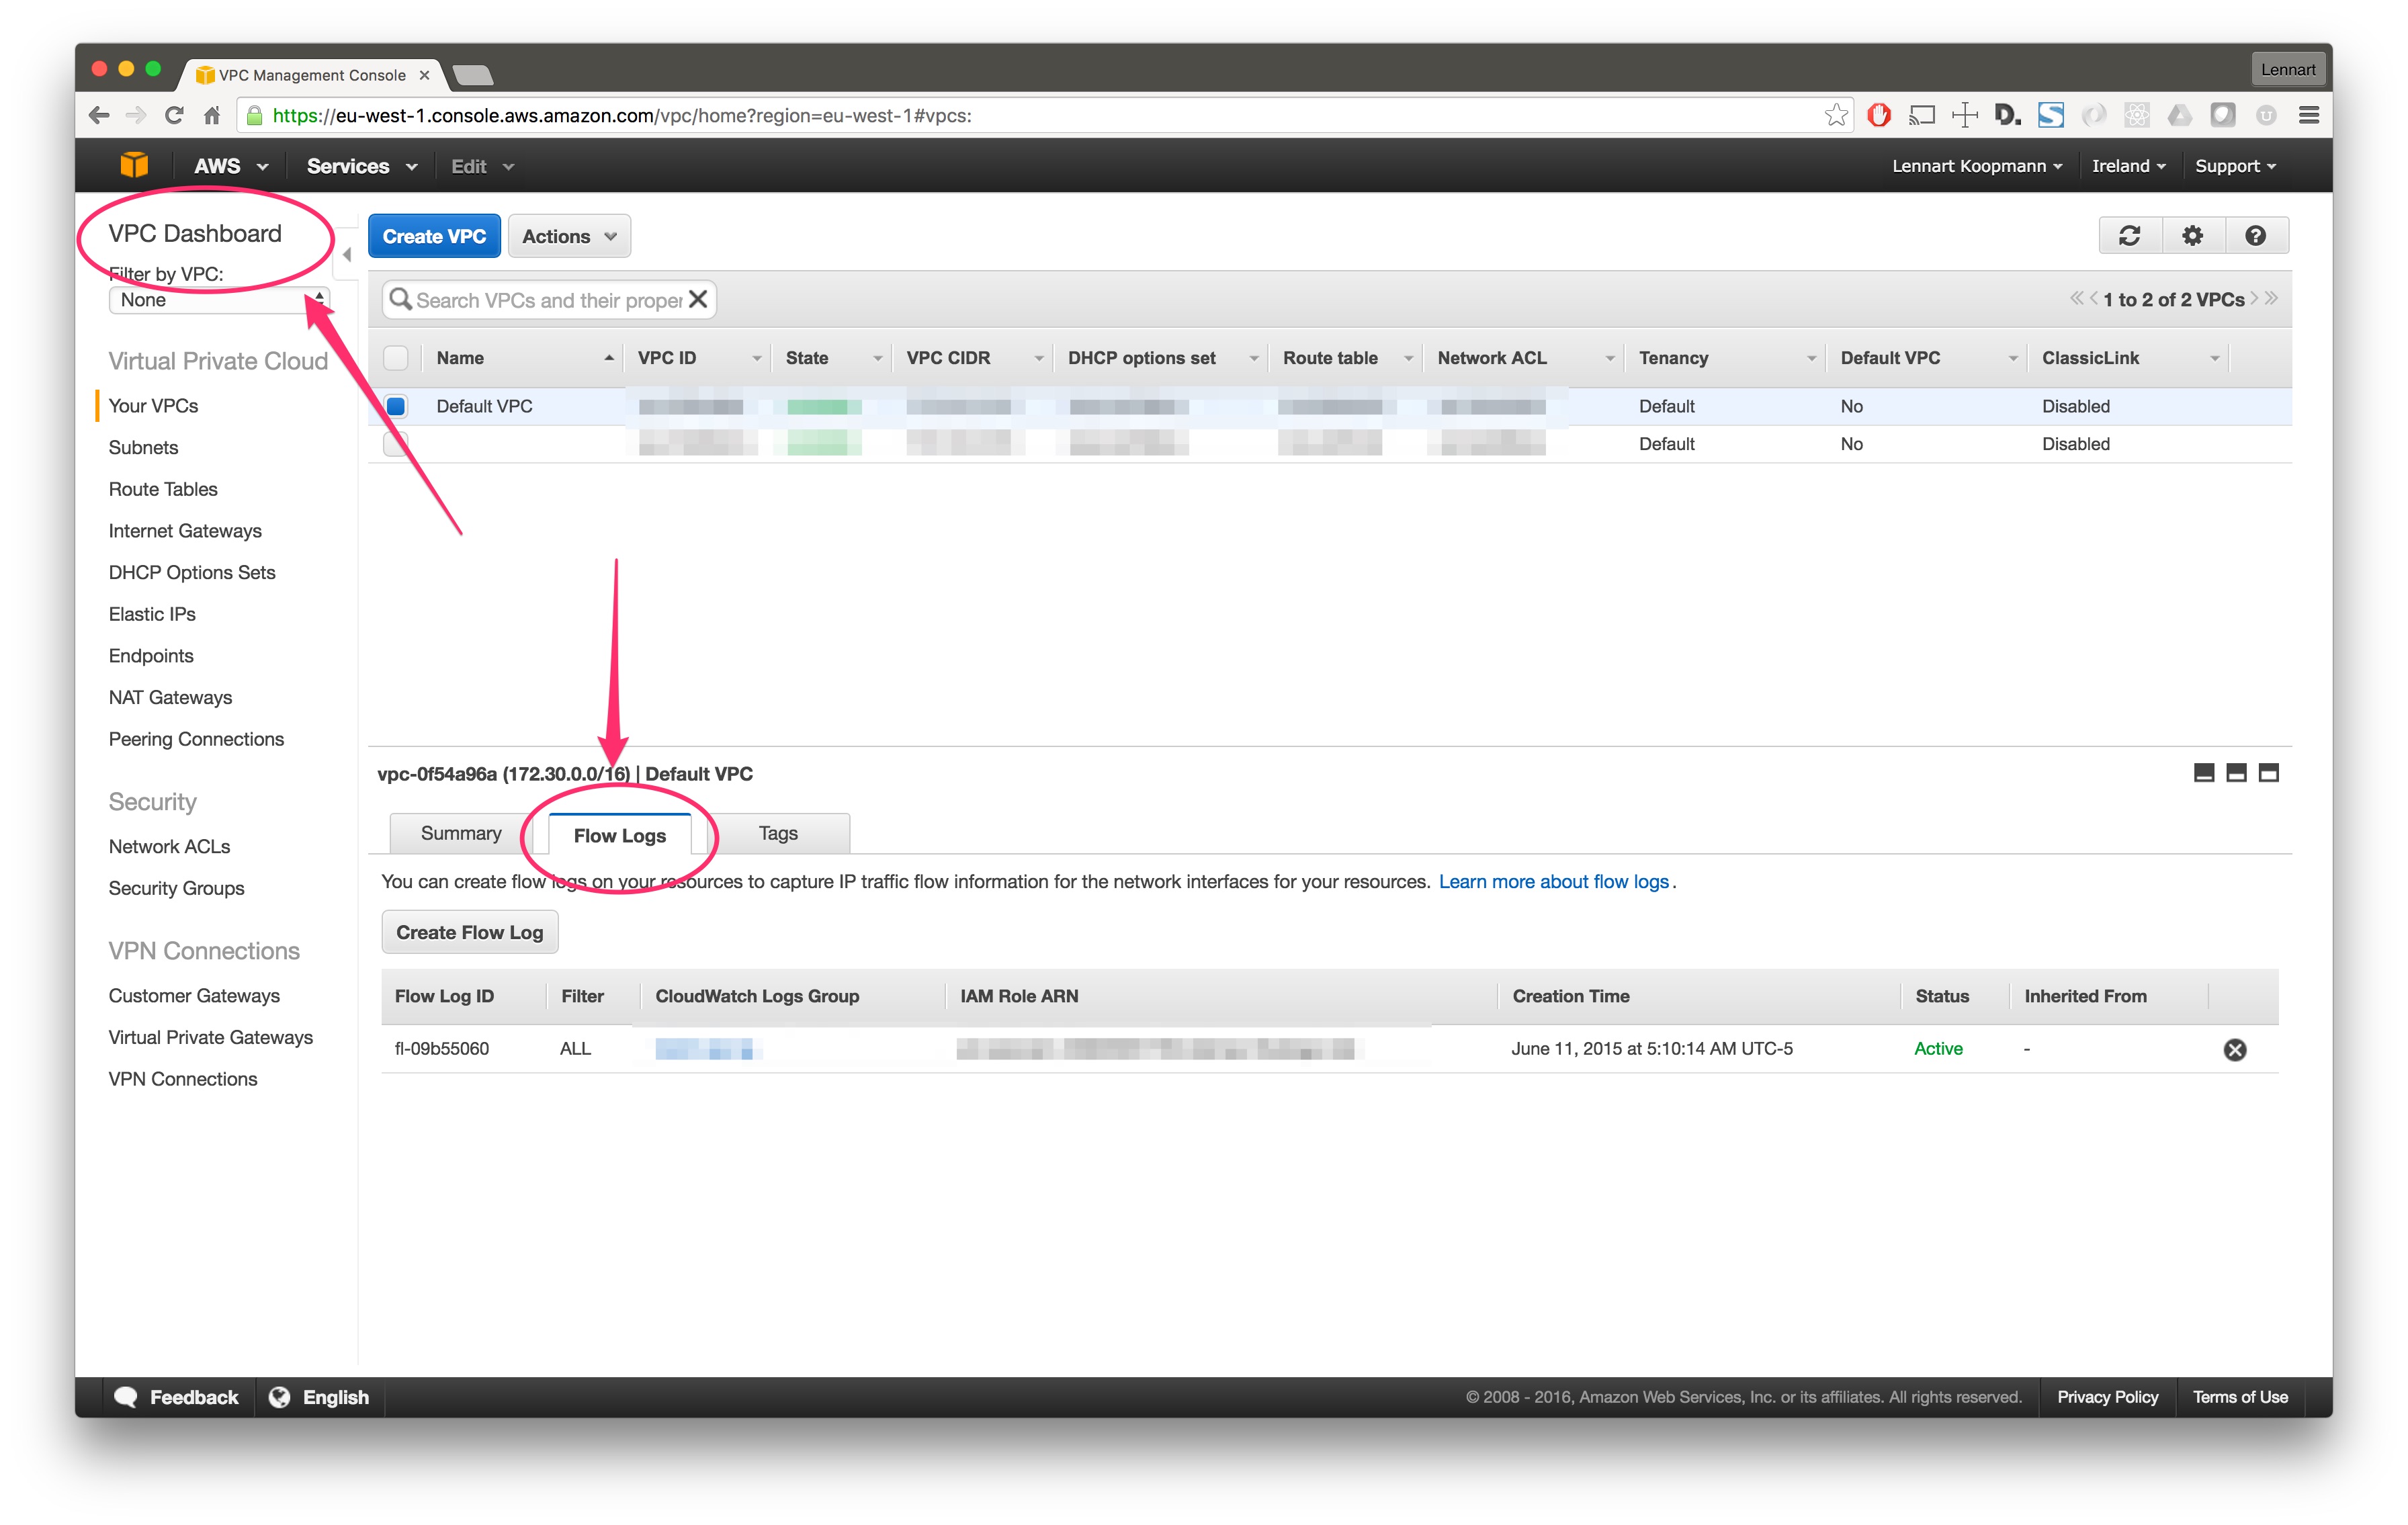
… or for all network interfaces in your VPC using the VPC console:
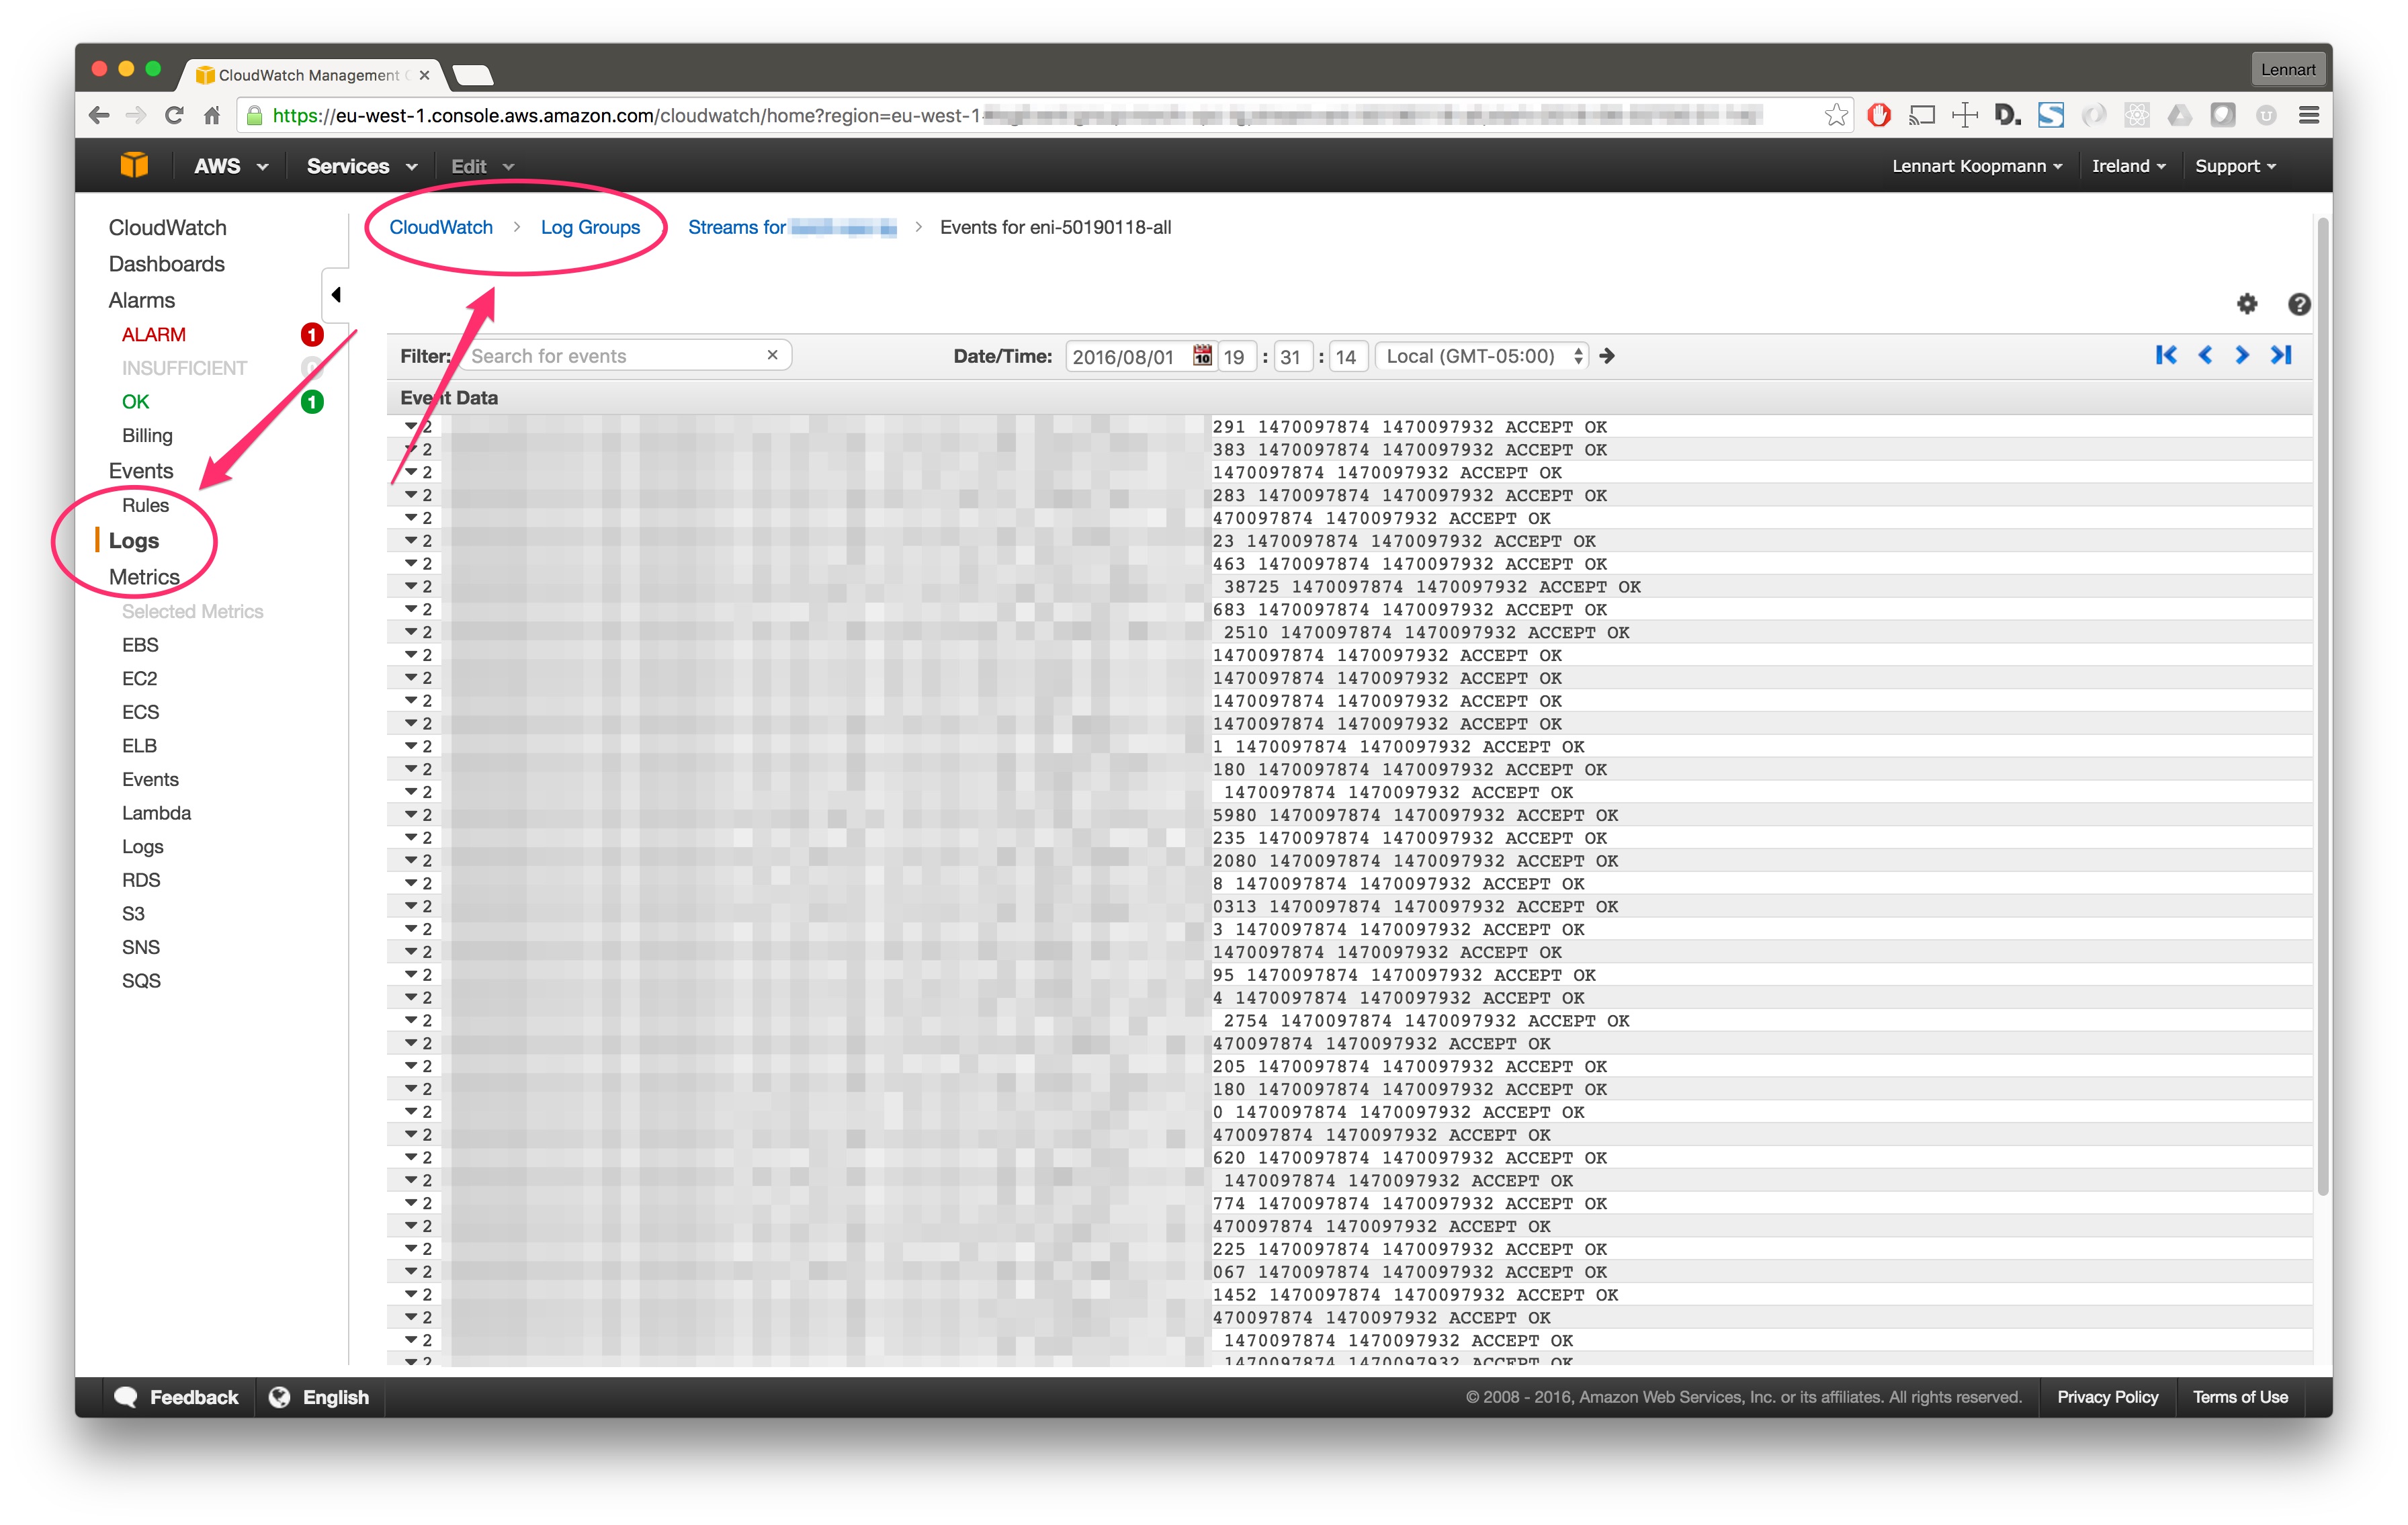
After a few minutes (usually 15 minutes but it can take up to an hour), AWS will start writing Flow Logs and you can view them in your CloudWatch console:
Now let’s go on and instruct AWS to write the FlowLogs to a Kinesis stream.
Steps 2: Set up Kinesis stream
Create a Kinesis stream using the AWS CLI tools:
aws kinesis create-stream --stream-name "flowlogs" --shard-count 1
Now get the Stream details:
aws kinesis describe-stream --stream-name "flowlogs"
Copy the StreamARN from the output. We’ll need it later.
Next, create a file called trust_policy.json with the following content:
{
  "Statement": {
    "Effect": "Allow",
    "Principal": { "Service": "logs.eu-west-1.amazonaws.com" },
    "Action": "sts:AssumeRole"
  }
}
Make sure to change the Service from eu-west-1 to the Region you are running in.
Now create a a new IAM role with the permissions in the file we just created:
aws iam create-role --role-name CWLtoKinesisRole --assume-role-policy-document file://trust_policy.json
Copy the ARN of the role you just created. You’ll need it in the next step.
Create a new file called permissions.json and set both ARNs to the ARNs your copied above:
{
  "Statement": [
    {
      "Effect": "Allow",
      "Action": "kinesis:PutRecord",
      "Resource": "[YOUR KINESIS STREAM ARN HERE]"
    },
    {
      "Effect": "Allow",
      "Action": "iam:PassRole",
      "Resource": "[YOUR IAM ARN HERE]"
    }
  ]
}
Now attach this role:
aws iam put-role-policy --role-name CWLtoKinesisRole --policy-name Permissions-Policy-For-CWL --policy-document file://permissions.json
The last step is to create the actual subscription that will write the Flow Logs to Kinesis:
aws logs put-subscription-filter \
    --filter-name "MatchAllValidFilter" \
    --filter-pattern "OK" \
    --log-group-name "my-flowlogs" \
    --destination-arn "[YOUR KINESIS STREAM ARN HERE]" \
    --role-arn "[YOUR IAM ARN HERE]"
You should now see Flow Logs being written into your Kinesis stream.
Step 3: Create AWS user for running the input
IAM permissions required for the input user:
{
  "Version": "2012-10-17",
  "Statement": [
    {
      "Sid": "VisualEditor0",
      "Effect": "Allow",
      "Action": [
        "cloudwatch:PutMetricData",
        "dynamodb:CreateTable",
        "dynamodb:DescribeTable",
        "dynamodb:GetItem",
        "dynamodb:PutItem",
        "dynamodb:Scan",
        "dynamodb:UpdateItem",
        "ec2:DescribeInstances",
        "ec2:DescribeNetworkInterfaceAttribute",
        "ec2:DescribeNetworkInterfaces",
        "elasticloadbalancing:DescribeLoadBalancerAttributes",
        "elasticloadbalancing:DescribeLoadBalancers",
        "kinesis:GetRecords",
        "kinesis:GetShardIterator",
        "kinesis:ListShards"
      ],
      "Resource": "*"
    }
  ]
}
Once the user is created, take note of the Access key ID Secret access key. You will need these to properly configure the input in AWS.
Step 4: Launch input
Now go into the Graylog Web Interface and start a new AWS Flow Logs input . It will ask you for some simple parameters like the Kinesis Stream name you are writing your Flow Logs to.
You should see something like this in your graylog-server log file after starting the input:
2017-06-03T15:22:43.376Z INFO  [InputStateListener] Input [AWS FlowLogs Input/5932d443bb4feb3768b2fe6f] is now STARTING
2017-06-03T15:22:43.404Z INFO  [FlowLogReader] Starting AWS FlowLog reader.
2017-06-03T15:22:43.404Z INFO  [FlowLogTransport] Starting FlowLogs Kinesis reader thread.
2017-06-03T15:22:43.410Z INFO  [InputStateListener] Input [AWS FlowLogs Input/5932d443bb4feb3768b2fe6f] is now RUNNING
2017-06-03T15:22:43.509Z INFO  [LeaseCoordinator] With failover time 10000 ms and epsilon 25 ms, LeaseCoordinator will renew leases every 3308 ms, takeleases every 20050 ms, process maximum of 2147483647 leases and steal 1 lease(s) at a time.
2017-06-03T15:22:43.510Z INFO  [Worker] Initialization attempt 1
2017-06-03T15:22:43.511Z INFO  [Worker] Initializing LeaseCoordinator
2017-06-03T15:22:44.060Z INFO  [KinesisClientLibLeaseCoordinator] Created new lease table for coordinator with initial read capacity of 10 and write capacity of 10.
2017-06-03T15:22:54.251Z INFO  [Worker] Syncing Kinesis shard info
2017-06-03T15:22:55.077Z INFO  [Worker] Starting LeaseCoordinator
2017-06-03T15:22:55.279Z INFO  [LeaseTaker] Worker graylog-server-master saw 1 total leases, 1 available leases, 1 workers. Target is 1 leases, I have 0 leases, I will take 1 leases
2017-06-03T15:22:55.375Z INFO  [LeaseTaker] Worker graylog-server-master successfully took 1 leases: shardId-000000000000
2017-06-03T15:23:05.178Z INFO  [Worker] Initialization complete. Starting worker loop.
2017-06-03T15:23:05.203Z INFO  [Worker] Created new shardConsumer for : ShardInfo [shardId=shardId-000000000000, concurrencyToken=9f6910f6-4725-3464e7e54251, parentShardIds=[], checkpoint={SequenceNumber: LATEST,SubsequenceNumber: 0}]
2017-06-03T15:23:05.204Z INFO  [BlockOnParentShardTask] No need to block on parents [] of shard shardId-000000000000
2017-06-03T15:23:06.300Z INFO  [KinesisDataFetcher] Initializing shard shardId-000000000000 with LATEST
2017-06-03T15:23:06.719Z INFO  [FlowLogReader] Initializing Kinesis worker.
2017-06-03T15:23:44.277Z INFO  [Worker] Current stream shard assignments: shardId-000000000000
2017-06-03T15:23:44.277Z INFO  [Worker] Sleeping ...
It will take a few minutes until the first logs are coming in.
Important: AWS delivers Flow Logs intermittently in batches (usually in 5 to 15 minute intervals), and sometimes out of order. Keep this in mind when searching over messages in a recent time frame.
Throttling
Starting in version 2.5.0, the AWS Flow Logs and AWS Logs inputs support the ability to throttle if contention occurs in the Graylog Journal. Throttling will slow the rate of AWS Kinesis stream intake for these inputs by pausing processing until the Journal contention is cleared when the node catches up. If the contention lasts for more than 60 seconds, then the Kinesis consumer will be temporarily stopped until the Journal contention is resolved. This setting can help to slow down the processing of large, intermittent log batches. If frequent long/disruptive throttling occurs, then additional hardware resources may need to be allocated to the Graylog node where the input is running.
To enable throttling, edit the input and check the Allow throttling this input checkbox.
See the Input Throttling section of the Graylog docs for more information about how and when throttling will occur.
CloudTrail setup and configuration
This input uses the AWS SDK to communicate with various AWS resources. Therefore, HTTPS communication must be permitted between the Graylog server and each of the resources. If communication on the network segment containing the Graylog cluster is restricted, please make sure that communication to the following endpoints is explicitly permitted.
monitoring.<region>.amazonaws.com
cloudtrail.<region>.amazonaws.com
sqs.<region>.amazonaws.com
sqs-fips.<region>.amazonaws.com
<bucket-name>.s3-<region>.amazonaws.com
Step 1: Enabling CloudTrail for an AWS region
Start by enabling CloudTrail for an AWS region:
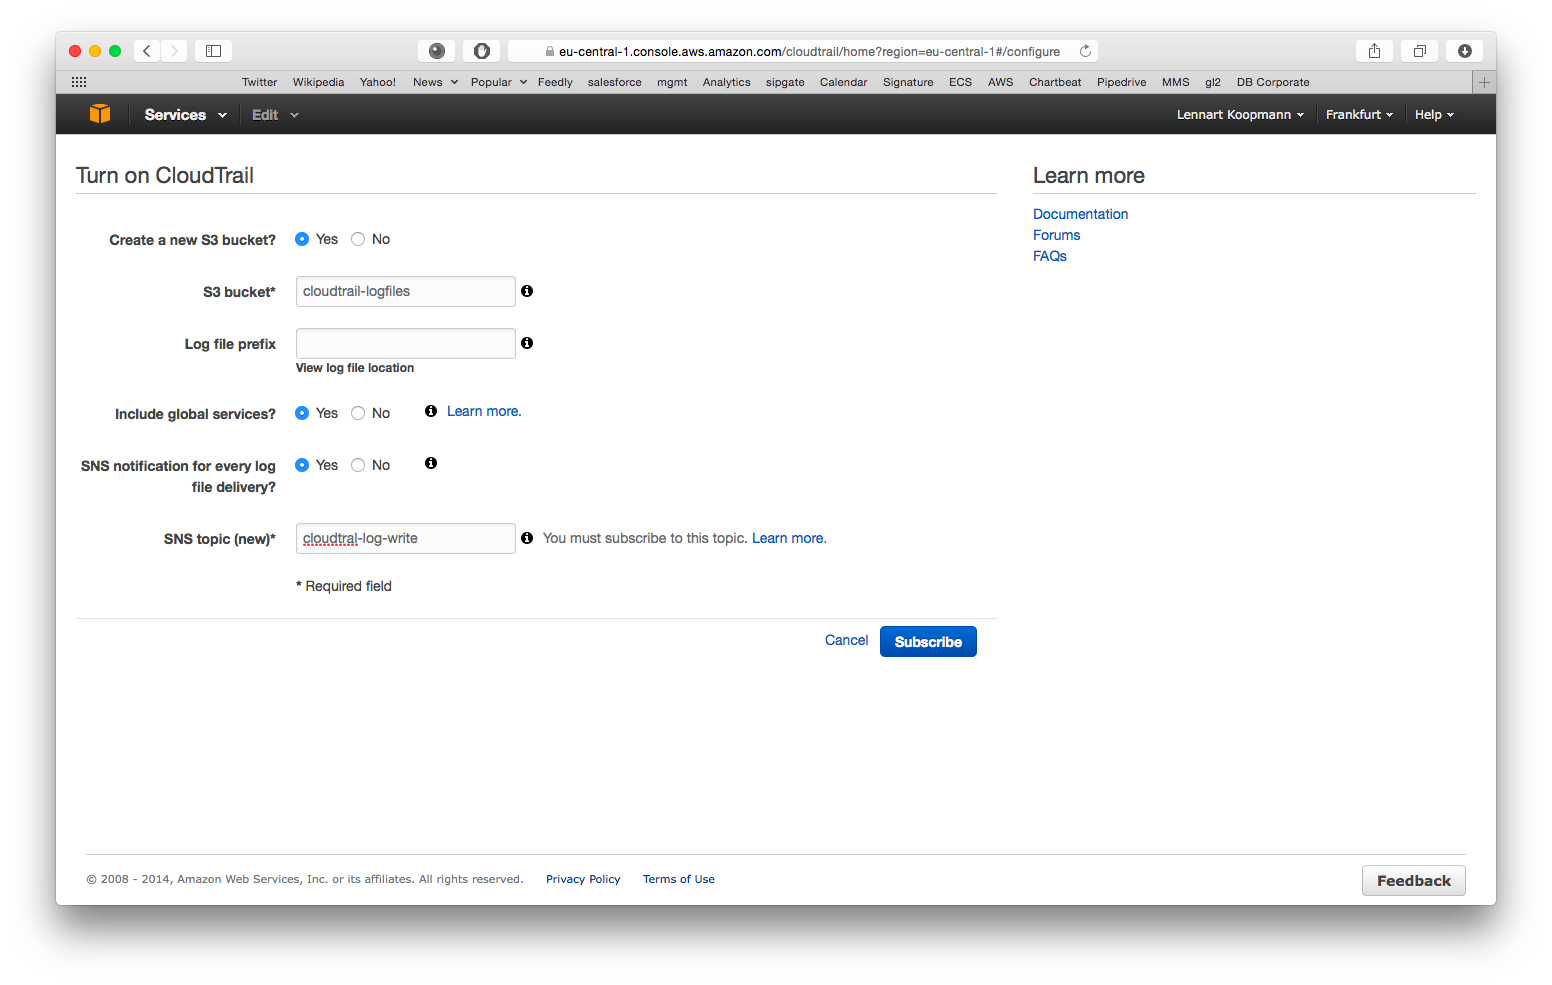
- Create a new S3 bucket: Yes
- S3 bucket: Choose anything here, you do not need it for configuration of Graylog later
- Log file prefix: Optional, not required for Graylog configuration
- Include global services: Yes (you might want to change this when using CloudTrail in multiple AWS regions)
- SNS notification for every log file delivery: Yes
- SNS topic: Choose something like cloudtrail-log-write here. Remember the name.
Step 2: Set up SQS for CloudTrail write notifications
Navigate to the AWS SQS service (in the same region as the just enabled CloudTrail) and hit Create New Queue .
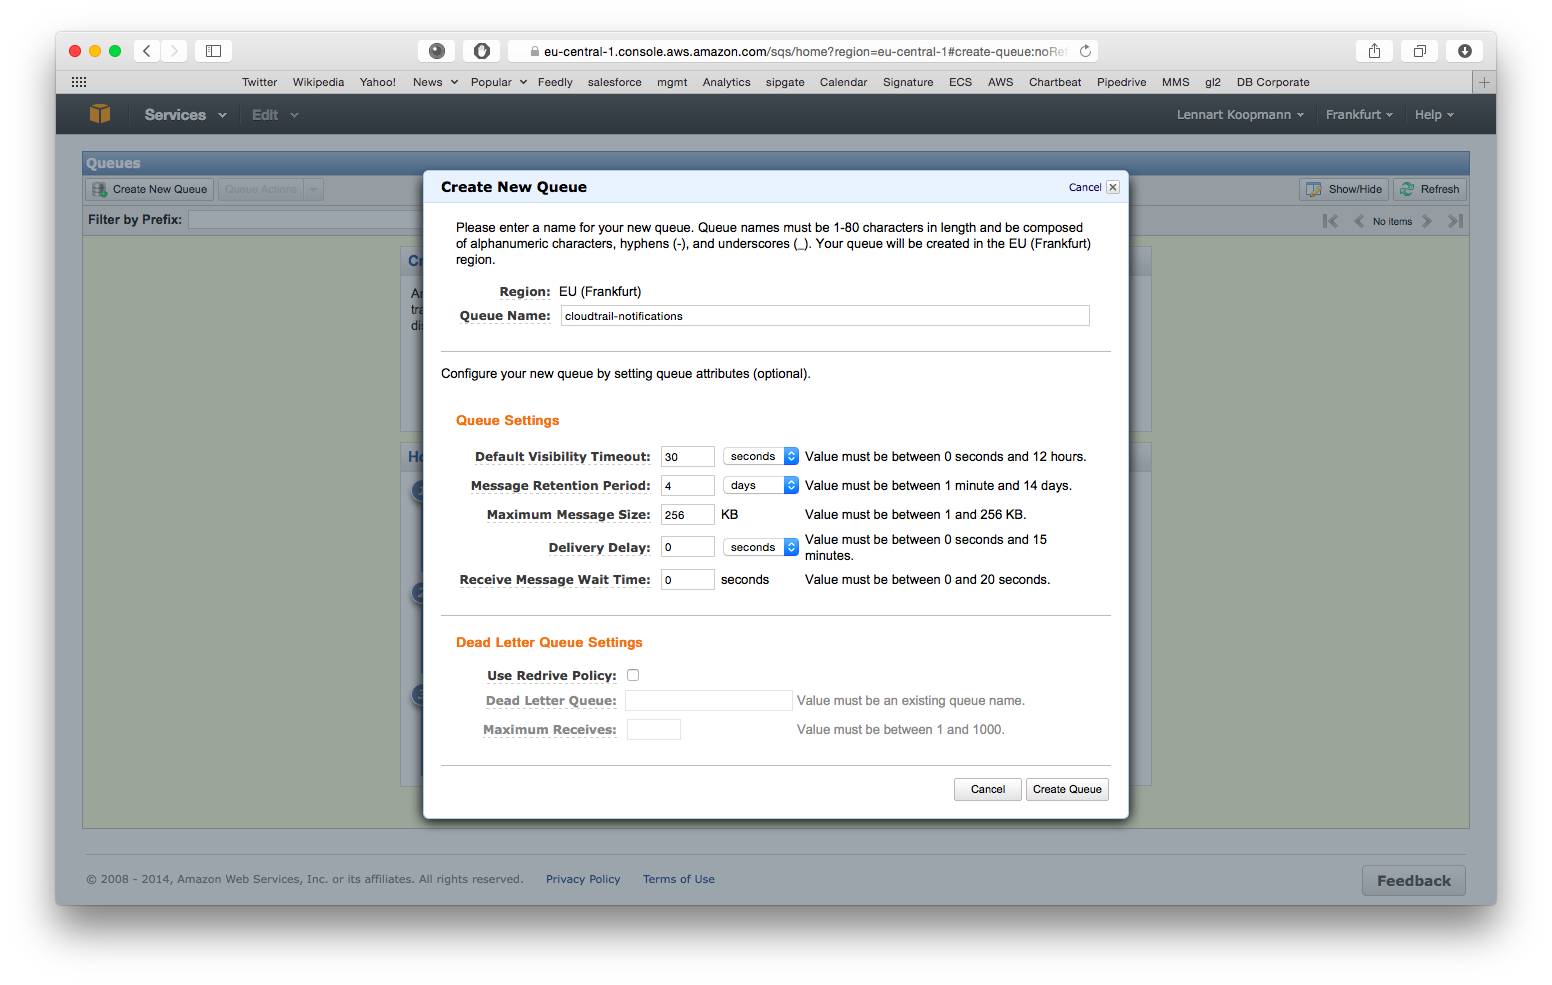
You can leave all settings on their default values for now but write down the Queue Name because you will need it for the Graylog configuration later. Our recommended default value is cloudtrail-notifications .
CloudTrail will write notifications about log files it wrote to S3 to this queue and Graylog needs this information. Let’s subscribe the SQS queue to the CloudTrail SNS topic you created in the first step now:
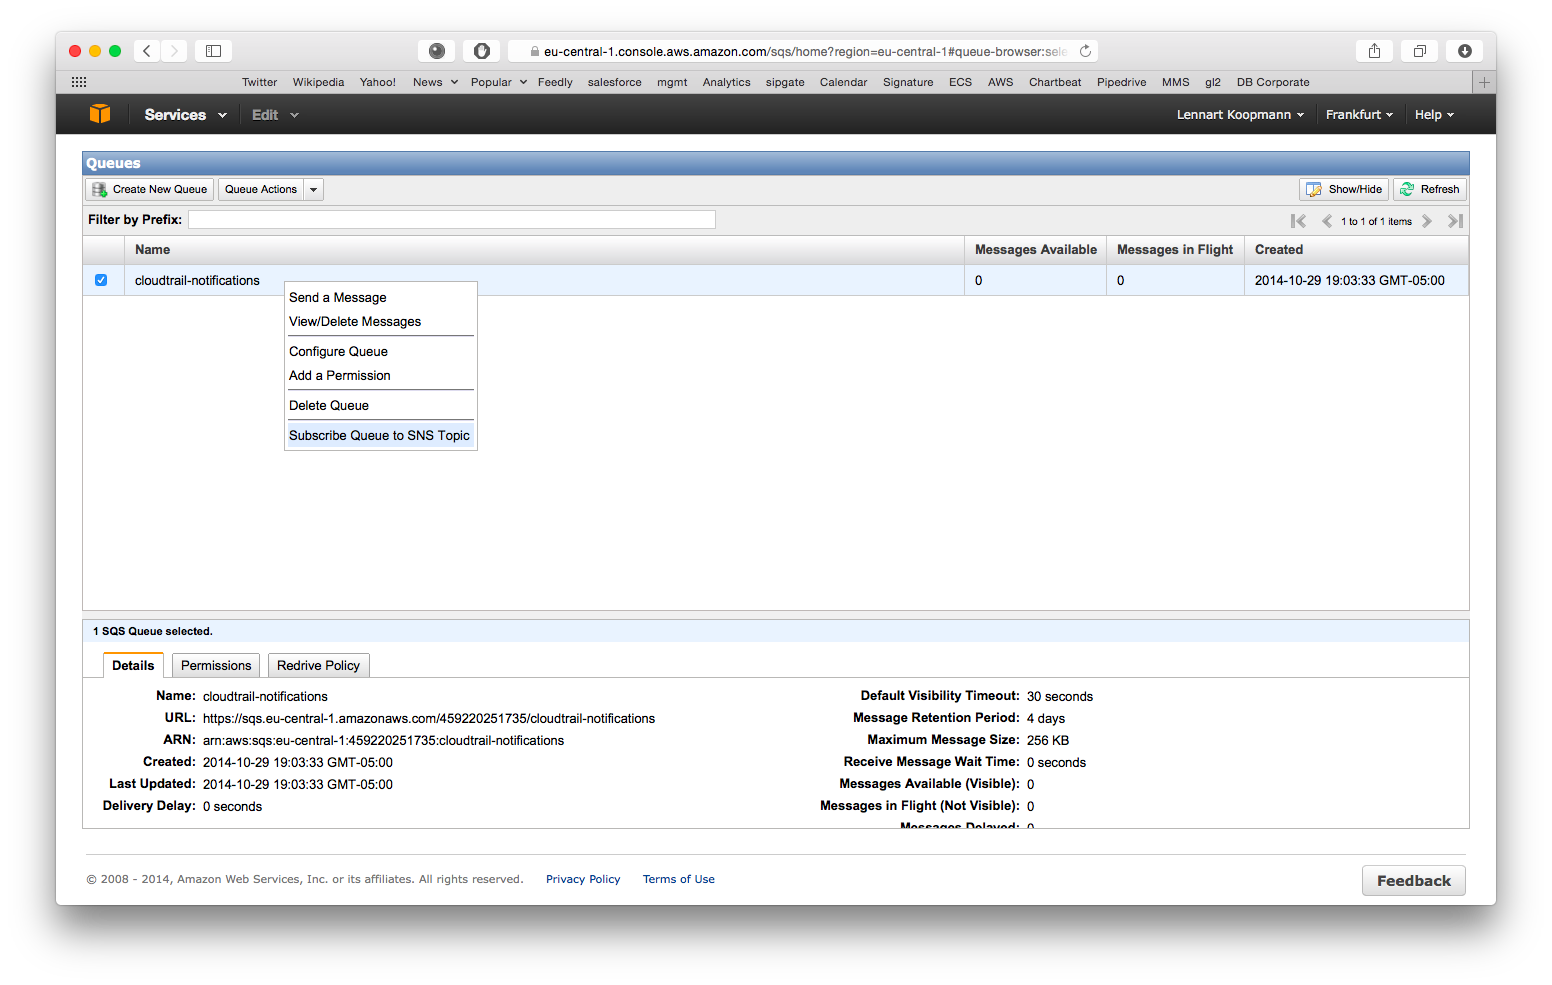
Right click on the new queue you just created and select Subscribe Queue to SNS Topic . Select the SNS topic that you configured in the first step when setting up CloudTrail. Hit subscribe, but make sure not to check the Raw message delivery option. See this AWS docs page for more info on raw message delivery.
That’s it! You’re are all done with the AWS configuration.
Step 3: Install and configure the Graylog CloudTrail plugin
Copy the .jar file that you received to your Graylog plugin directory which is configured in your graylog.conf configuration file using the plugin_dir variable.
Restart graylog-server and you should see the new input type AWS CloudTrail Input at System → Inputs → Launch new input . The required input configuration should be self-explanatory.
Important: The IAM user you configured in “System → Configurations” has to have permissions to read CloudTrail logs from S3 and write notifications from SQS:
{ “Version”: “2012-10-17”, “Statement”: [ { “Sid”: “Stmt1411854479000”, “Effect”: “Allow”, “Action”: [ “s3:GetObject” ], “Resource”: [ “arn:aws:s3:::cloudtrail-logfiles/*” ] } ] }
{ “Version”: “2012-10-17”, “Statement”: [ { “Sid”: “Stmt1411834838000”, “Effect”: “Allow”, “Action”: [ “sqs:DeleteMessage”, “sqs:ReceiveMessage” ], “Resource”: [ “arn:aws:sqs:eu-west-1:450000000000:cloudtrail-write” ] } ] }
(Make sure to replace resource values with the actual ARNs of your environment)
More required IAM roles: The way we communicate with Kinesis requires us to store some metadata in AWS DynamoDB and we are also writing some metrics back to AWS CloudWatch. For this to work you have to attach the following standard AWS IAM policies to your AWS API user:
- CloudWatchFullAccess
- AmazonDynamoDBFullAccess
- AmazonKinesisReadOnlyAccess
Note that these are very open standard permissions. We recommend to use them for a test setup but further boil them down to only allow access (read+write) to the DynamoDB table we automatically created (you’ll see it in the list of tables) and also to only call cloudwatch:PutMetricData . How to get the ARNs and how to create custom policies would be out of scope for this guide.
Usage
You should see CloudTrail messages coming in after launching the input. (Note that it can take a few minutes based on how frequent systems are accessing your AWS resource) You can even stop Graylog and it will catch up with all CloudTrail messages that were written since it was stopped when it is started a!gain.
Now do a search in Graylog. Select “Search in all messages” and search for: source:"aws-cloudtrail"
Troubleshooting
Enable Debug Logging
To troubleshoot the AWS plugin, it may be useful to turn on debug logging for this plugin specifically. Note that changing the Graylog subsystem logging level to DEBUG in System > Logging does not affect the logging level for the AWS plugin. You will need to use the Graylog API to enable logging for this plugin. Execute this curl command against the Graylog node running the AWS plugin to enable DEBUG logging for it:
curl -I -X PUT http://<graylog-username>:<graylog-password>@<graylog-node-ip>:9000/api/system/loggers/org.graylog.aws/level/debug
CloudTrail troubleshooting
If the CloudTrail input is starting, and the debug log messages show that messages are being received, but no messages are visible when searching in Graylog, then make sure the SQS subscription is not set to deliver the messages in raw format.
Build
This project is using Maven 3 and requires Java 8 or higher.
You can build a plugin (JAR) with mvn package .
DEB and RPM packages can be build with mvn jdeb:jdeb and mvn rpm:rpm respectively.
Plugin Release
We are using the maven release plugin:
$ mvn release:prepare
[...]
$ mvn release:perform
This sets the version numbers, creates a tag and pushes to GitHub. Travis CI will build the release artifacts and upload to GitHub automatically.