Hello ,
Suddenly my graylog is crashed, I cannot receive the palo alto firewall logs or no others Vm linux for my infrastructure - Please help
There were 6,858 failed indexing attempts in the last 24 hours.
I’m a little confused by your screenshots since one has your ES status as green and another has it as red. Is your ES status red or green? Have you looked at the ES logs?
I think the problem is in the indexing of the logs, the indexing posed a problem  There were 6,858 failed indexing attempts in the last 24 hours.
now I can receive the logs , but the problem in Indexer failues
Display Dhashboard:
While retrieving data for this widget, the following error(s) occurred:
- Unable to perform search query: java.util.concurrent.ExecutionException: ElasticsearchException[java.util.concurrent.ExecutionException: CircuitBreakingException[[parent] Data too large, data for [source] would be [728827392/695mb], which is larger than the limit of [726571417/692.9mb], usages [request=0/0b, fielddata=149837342/142.8mb, in_flight_requests=932292/910.4kb, accounting=578057758/551.2mb]]]; nested: ExecutionException[CircuitBreakingException[[parent] Data too large, data for [source] would be [728827392/695mb], which is larger than the limit of [726571417/692.9mb], usages [request=0/0b, fielddata=149837342/142.8mb, in_flight_requests=932292/910.4kb, accounting=578057758/551.2mb]]]; nested: CircuitBreakingException[[parent] Data too large, data for [source] would be [728827392/695mb], which is larger than the limit of [726571417/692.9mb], usages [request=0/0b, fielddata=149837342/142.8mb, in_flight_requests=932292/910.4kb, accounting=578057758/551.2mb]];.
Looks like the issue is with ES and the amount of memory/heap you have allocated.
what version of ES are you running? what are your system specs?
Journal utilization is too high and may go over the limit soon. Please verify that your Elasticsearch cluster is healthy and fast enough. You may also want to review your Graylog journal settings and set a higher limit. (Node: 9c349e50-cda8-43ca-b6c1-a980b10fd5b6 )
I couldn’t solve this problem , please Help
@cawfehman I thnik the problem in Journal utilization is too high (triggered an hour ago)
Journal utilization is too high and may go over the limit soon. Please verify that your Elasticsearch cluster is healthy and fast enough. You may also want to review your Graylog journal settings and set a higher limit. (Node: 9c349e50-cda8-43ca-b6c1-a980b10fd5b6 )
Good for now, I solved the problem by modifying :
message_journal_max_age
message_journal_max_size
in the graylog-server.conf file
glad it’s working… your journal fills up when Graylog can’t push the messages through the processing pipelines and out to ES fast enough. There’s alot of potential bottlenecks, from disk to cpu/RAM. If it happens again (I would think it would) you may need to dig a bit more.
Good luck.
thank you very much for your feedback, it’s very nice, good, my graylog server I think it’s quite efficient on the resources side (ram, cpu, storage …) … but the problem on the firewall side, I really receive a lot of logs.
@cawfehman Good luck to you too 
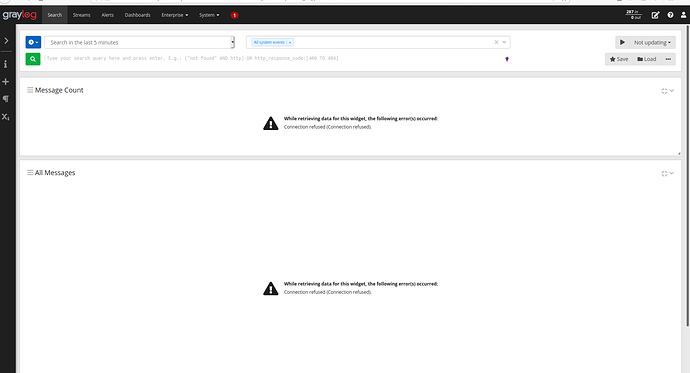
The problem is back, up there in the dashboard for sending log: out always 0 (in / out) (843/0)
While retrieving data for this widget, the following error(s) occurred:
- Connection refused (Connection refused).
what do your buffers look like? input, process, output buffers? What’s your java heap at? How much CPU/RAM do you have?
Hi @cawfehman my graylog server have : 16GB RAM, CPU: 8 CPU
is your elasticsearch and you graylog on the same system?
how are your processors allocated in the graylog server.conf?

how much Java heap do you have allocated?
Hello @cawfehman
Yes Graylog and elasticsearch in the same host ! this is the current state of processbuffer_processors and outputbuffer_processors:
processbuffer_processors = 5
outputbuffer_processors = 3
How much does the value increase ??? How can I know , how much Java heap allocated ???
@Labidi, is this the same server we discussed in this thread?
You mention there that the specs are 12 GB RAM and 8 CPU, but here you say 16 GB and 8 CPU. To help you allocate memory optimally can you clarify?
If this is the same server being discussed in both threads it’s apparent Elasticsearch is having some issues, in the other thread you did not mention that the Elasticsearch service was having periods of being unreachable which means most likely that it is crashing repeatedly. What errors are present in the Elasticsearch log?
You can view heap size in /etc/elasticsearch/jvm.options


